Sunday, January 27, 2019

More on the 2016 election

This is an extension of another recent post on this blog in which I outlined several hypothetical Electoral College maps. First, I want to depict what the results of the 2016 Democratic primaries would have been if delegates were awarded winner-take-all, like electoral votes are in general presidential elections. Of course, this also assumes that each state has the exact same number of delegates as it does electoral votes (which is definitely not true); it also ignores primaries in non-state territories like Puerto Rico which can vote in primaries but not in general presidential elections, and the fact that ME and NE have different electoral college systems, but whatever: let's get into it.

So the map below shows the results of the primaries: Clinton won yellow states on this map while Sanders won green states. Darker yellow =  greater % margin of victory for Clinton and darker green = greater % margin of victory for Sanders.


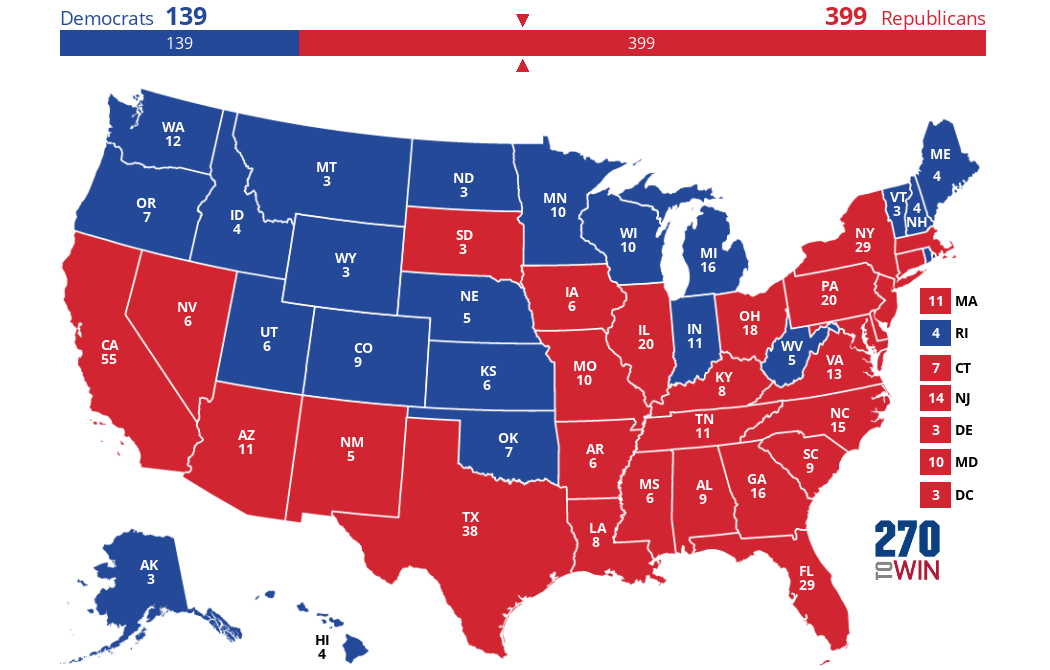
First, let's convert this into an electoral map regardless of margin of victory, with Clinton as red and Sanders as blue:
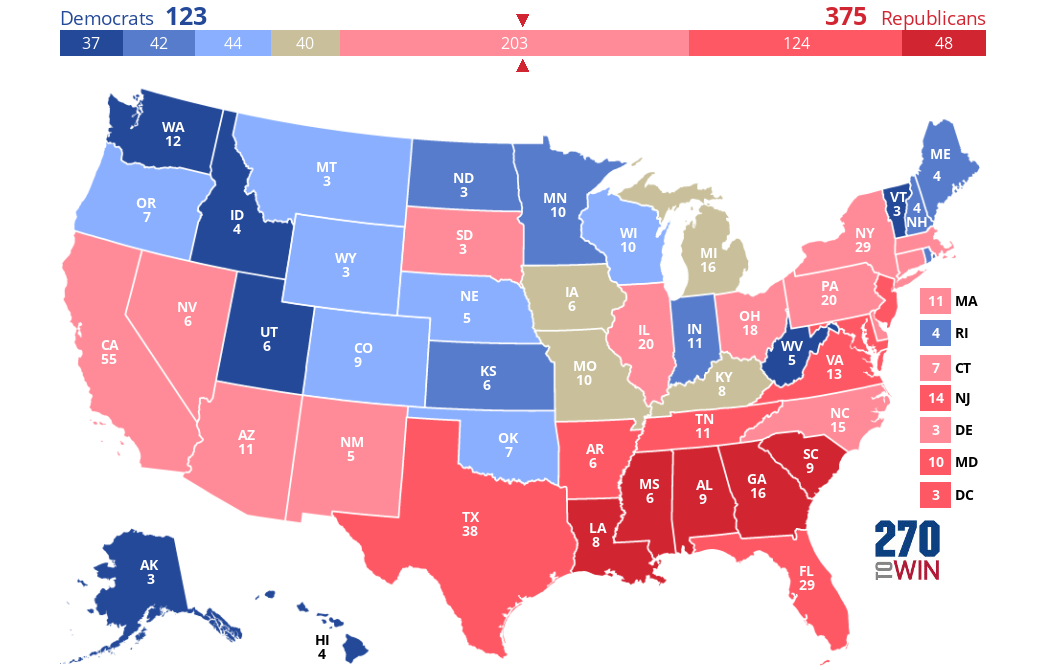
So we see here a very comfortable victory for Clinton, who wins 399 electoral votes to Sanders' 139. This gives Clinton about 74% of the electoral votes (EVs) to only 26% for Sanders. This, of course, is not very fair because Clinton only actually got about 55% of the vote in all primaries/caucuses combined, compared to about 43% for Sanders. Part of this disproportionality is because the above map, being winner-take-all, masks the fact that some primaries were much closer than others. This can be seen in my second map, made based on data from the source linked above. States where either candidate won with <50% of the vote are gray on the map below. The three color levels are 50-60%, 60-70%, and 70+%.


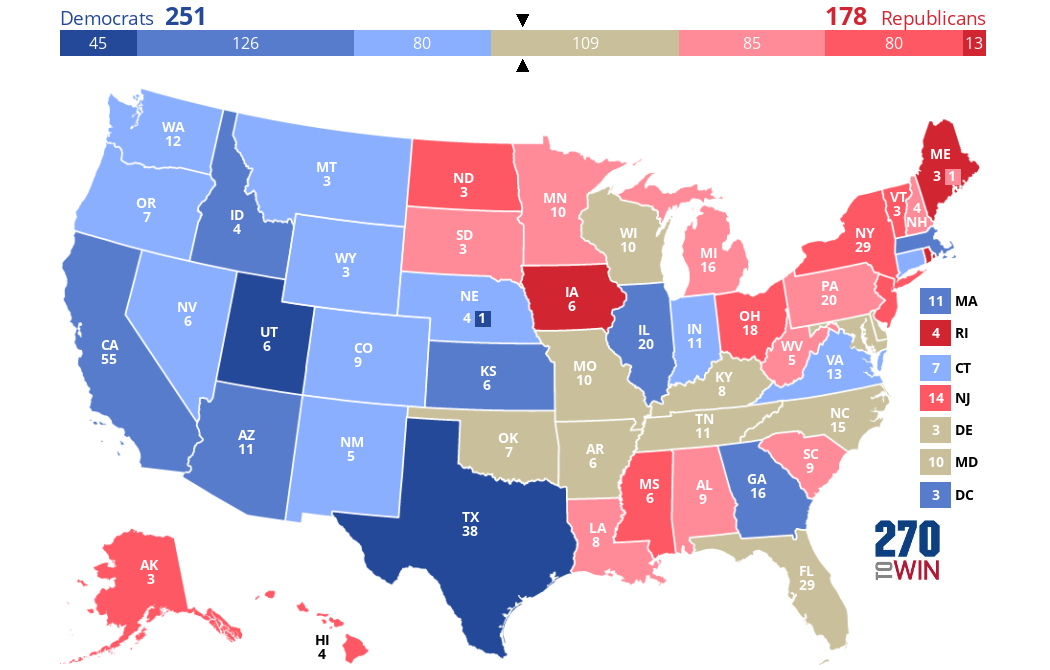
I also wanted to show some maps with different metrics, both related to the general election. The idea is as follows: take the shift from 2008 to 2012, then use that to predict the results of the 2016 election (I already did this in my previous post). Then, take the difference between this prediction and the actual 2016 election results, and create a map of this difference (blue = Clinton did better than this prediction and vice versa). In this map, if the difference is <1% either way, the state will be gray. So here it is:
This map looks quite different from any other map I've looked at regarding the 2016 election. So what we see is that Clinton did much better than expected (based on trends from 2008 to 2012) in Texas and Utah, while Trump did much better than expected in Iowa, Maine, and Rhode Island of all places! This despite the fact that Trump did win IA, but he lost both ME and RI. We also see that most states (29 out of 51 or 57%, including DC as a state and not counting individual congressional districts) were less than 5 points off in either direction from what would be predicted here. Furthermore, we see that Clinton did remarkably well almost everywhere in the west, with the notable exceptions of both Dakotas and Oklahoma. In fact, she did at least 1% better than expected even in some of the most Republican states in the US out west, including Wyoming, Montana, and Idaho (Idaho voted about the same in 2016 as it did in 2012).

Lastly, Clinton's performance in Wisconsin is also very much in line with what would be expected, and even in MI and PA, she did only slightly worse than one would expect. Trump also did only slightly better in WV than you'd expect, indicating that his landslide victory there was actually not very unusual. OH and IA are different stories, however, as Trump did much better in both (especially IA) than you would expect. And most of the medium/dark blue states here also voted more D overall from 2012 to 2016 (CA, AZ, TX, my own state of GA, KS, MA, etc.) It's also notable that NY and VT, among other New England states, voted a lot less Democratic than you'd expect in 2016.

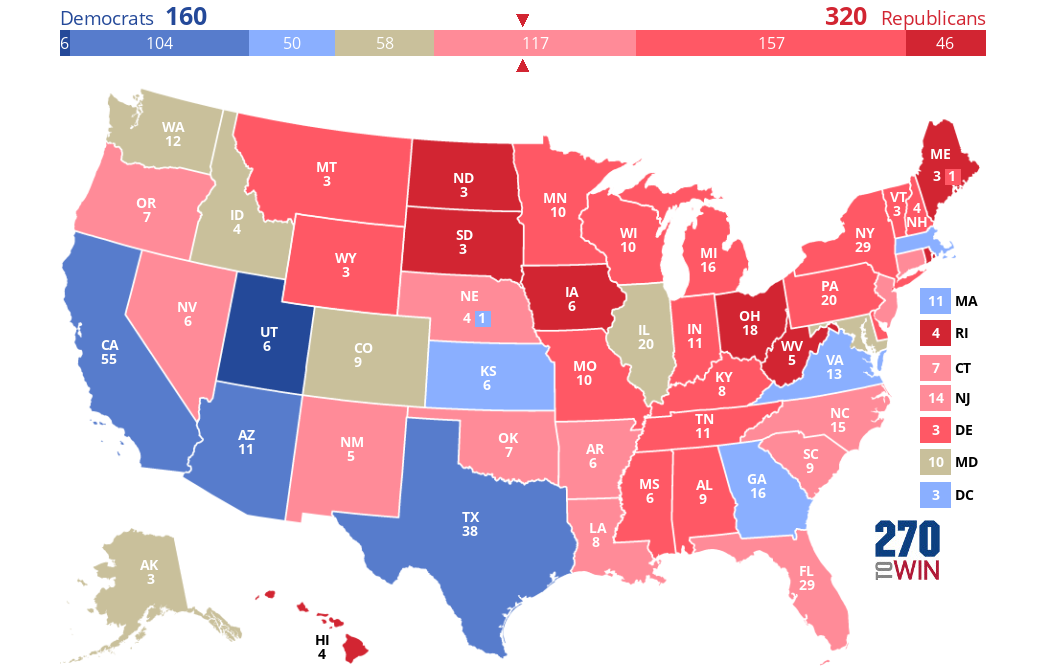
I also wanted to show another map I made based on the 2012-2016 shift in presidential election results for each state. Each value is the average of the shifts from Dave Leip's Atlas and a Google Doc spreadsheet (with the exception of congressional district results, which I calculated myself).


Thursday, January 24, 2019

Gould, Richardson et al. v. Spearman (2018)

Judge: Order, order in the court, settle down, everyone! Today, November 3, 2018, I wish to formally begin deliberations in the case of Stephen Jay Gould, Ken Richardson, et al. v. Charles Spearman.  Spearman, the defendant, has been charged with one count of reification, one count of conflating correlation and causation, and one count of attempting the pointless task of accurately reducing a complex entity - namely, human intelligence - to a single number. The plaintiffs include Gould, Richardson, Henry Schlinger, and a number of others  from whom we shall soon be hearing. The plaintiffs will now be allowed to call their first witness to the stand. Mr. Lawyername, who do the plaintiffs want to present as their first expert witness?

John Lawyername, the lawyer for the plaintiffs: Your honor, we wish to present Henry Schlinger, professor at California State University, Los Angeles, as our first witness today.

Judge: Very well. Mr. Schlinger, please take the stand.

Schlinger: Thank you for allowing me to testify today. Ladies and gentlemen of the jury, I believe that Spearman "took an abstract mathematical correlation and reified it as the general intelligence that someone possesses" (Schlinger 2003, p. 17). In addition, "Spearman saw what he wanted to see in his data...Once the error of reification is committed, it is easy to commit another logical error, circular reasoning...In Spearman's case, the only evidence for g, or general intelligence, were the positive correlations, even though it was those positive correlations he was trying to explain in the first place" (ibid.). Lastly, Spearman portrays the results of factor analyses of IQ test scores as synonymous with intelligence, even though "The positive intercorrelations that result from factor analysis of their test scores are themselves far removed from the behavior of any individual in the test-taking situation or, for that matter, in any other context" (ibid.).

Judge: Mr. Spearman, who do you wish to call as your first expert witness?

Spearman: Next, I would like to call Charlie Reeve and Milton Hakel to the stand.
Reeve & Hakel: "All constructs are abstractions, purposely invoked to describe coherent classes of phenomena that co-occur in nature. For instance, gravity is a mathematical construct that describes one of the four classes of forces associated with matter. Similarly, g is a psychometric and psychological construct that describes a class of phenomena associated with results of human mental functioning. Both of these constructs are abstract ideas; both are latent. However, because the phenomena ascribed to these constructs can be observed, the constructs are subject to conceptual refinement, measurement, and verification" (Reeve & Hakel 2002, pp. 48-49).

The plaintiffs wish to call Stephen Jay Gould to the stand.
Gould: "The misuse of mental tests is not inherent in the idea of testing itself. It arises primarily from two fallacies, eagerly (so it seems) endorsed by those who wish to use tests for the maintenance of social ranks and distinctions: reification and hereditarianism" (Gould 1981, p. 155; cited in Carroll 1995). Also, "many factorists have...tried to define factors as causal entities. This error of reification has plagued the technique since its inception. It was "present at the creation" since Spearman invented factor analysis to study the correlation matrix of mental tests and then reified his principal component as g or innate, general intelligence" (Gould 1996, p. 284).

Judge: Who do you want to call  to respond to these accusations that you are guilty of reification?

Spearman: Your honor, I wish to call John Carroll as my first witness.

Carroll: Gould's criticisms of Spearman, and of research on IQ tests as a whole, are mistaken. This is because, contrary to Gould's assertions, "...factor analysis implies no "deep conceptual error" of "reification."...Merely because it is convenient to refer to a factor (like g) by use of a noun does not make it a physical thing. At the most, factors should be regarded as sources of variance, dimensions, intervening variables, or "latent traits" that are useful in explaining manifest phenomena, much as abstractions such as gravity, mass, distance, and force are useful in describing physical events. Gould's far-reaching condemnation of factor analysis as a device for producing reifications is one of his own deepest conceptual errors; it stands factor analysis on its head" (Carroll 1995).

And Jensen & Weng as my second witness.
"...Gould’s strawman [sic] issue of the reification of g was dealt with satisfactorily by the pioneers of factor analysis, including Spearman (1927) Burt (1940) and Thurstone (1947)...the consensus of experts is that g need not be a “thing”-a “single, ” “hard,” “object’‘-for it to be considered a reality in the scientific sense. The g factor is a construct. Its status as such is comparable to other constructs in science: mass, force, gravitation, potential energy, magnetic field, Mendelian genes, and evolution, to name a few. But none of these constructs is a "thing"" (Jensen & Weng 1994, p. 232).

The plaintiffs call Joseph L. Graves and Amanda Johnson to the stand.

Graves & Johnson: Spearman has clearly confused correlation with causation in positing the existence of a g factor based on positive correlations between IQ test scores. The fact is, "...such variables may be statistically correlated without necessarily having any functional relationship... Science recognizes this fact and demands the implementation of experimental techniques to establish causal relationships. Pseudoscience, on the other hand, is content with the bald assertion that, given a correlation, a causal relationship must exist" (Graves & Johnson 1995, p. 281).

Next we will deliberate the charge that the g factor identified by Spearman is inconsistent and unstable. 

The plaintiffs once again call Joseph L. Graves and Amanda Johnson to the stand.

Graves & Johnson: "...g can vary widely, depending on how it is calculated. Such admissions explain why batteries of tests applied to individuals and groups return different values of correlation; certainly, one would not expect a fundamental underlying mechanism to behave so capriciously. Similarly, a physicist would not expect to get different values for the speed of light depending on the technique used to measure it. Thus, the mutability of g significantly hinders the scientific legitimacy of psychometric theory" (Graves & Johnson 1995, p. 281).

The defendants call Johnson, te Nijenhuis, and Bouchard to the stand.
Johnson, te Nijenhuis, & Bouchard: "...the g factors identified by the batteries were completely correlated (correlations were .99, .99, and 1.00). This provides further evidence for the existence of a higher-level g factor and suggests that its measurement is not dependent on the use of specific mental ability tasks...Our analyses indicate that g factors from three independently developed batteries of mental ability tests are virtually interchangeable" (Johnson et al. 2004, p. 104) In a subsequent replication of this study, it was again found that "...the g factors were effectively interchangeable" (Johnson, te Nijenhuis, & Bouchard 2008, p. 89)

I also wish to  call Jensen & Weng to the stand again.
Jensen & Weng: "...g is remarkably robust and almost invariant across different methods of analysis, both in agreement between the estimated and the true g in simulated data and in similarity among the g factors extracted from empirical data by different methods" (Jensen & Weng 1994, p. 231).

Judge: So, Dr. Spearman, what is the main point that your witnesses wish to make regarding the plaintiffs' claims that your g factor is so inconsistent as to be scientifically invalid?

Spearman: The main point, your honor, is that these accusations, such as those by Graves & Johnson, are simply false. On the contrary, the evidence that has just been presented shows that the g factor is highly consistent no matter what method is used to calculate it.

Judge: This is a difficult case. It seems like the assumption that correlations between test scores prove the existence of a single dimension of intelligence is unwarranted, but referring to the existence of this correlation, which is not controversial, is not necessarily problematic. What is problematic is when researchers talk out of one side of their mouths and say "We never thought factors were actual things! We refer to them as constructs! The g factor is a construct, not a thing!" while, at other times and other places, talking about individual and group differences in g, the heritability of g, whether it is possible to boost g with Head Start programs, etc. None of these latter descriptions would make sense if these scholars did not believe that g were an actual human quality, rather than an abstract theoretical construct. Clearly, g theorists do treat the g factor as "a real property in the head" (Gould 1994), despite their frequent insistence.

References
Carroll. Reflections on Stephen Jay Gould's The Mismeasure of Man (1981). Intelligence. 1995.
Gould. The Mismeasure of Man (1st edition). 1981.
Gould 1994
Gould. The Mismeasure of Man (2nd edition). 1996.
Graves & Johnson 1995.
Jensen & Weng 1994.
Johnson et al. 2004.
Johnson, te Nijenhuis & Bouchard 2008.
Reeve & Hakel 2002.

Saturday, January 19, 2019

Emil Kirkegaard blogged about me?

It's true! Wow, this is a weird feeling to be in the spotlight like this, even if only to a relatively small extent (which this clearly is). Anyway, some background is in order: I submitted a paper to one of Kirkegaard's journals last year despite not agreeing with him on many controversial issues only to later decide to withdraw it while it was still being "reviewed" on one of their open "peer-review" forums (by reviewers who often have little/no relevant expertise). Anyway, this is about a post I recently made on reddit from a subreddit from which I have since been banned (namely, /r/heredity).

Basically I was reiterating arguments I considered to be compelling that I came across in Misbehaving Science, a 2014 book by Aaron Panofsky. I bought this book online through Amazon and finished reading it last summer. The arguments I was outlining were that behavior genetics  (BG) researchers, when responding to their critics, tend to focus on relatively narrow statistical and empirical issues, rather than more fundamental, and thus important, underlying theoretical/conceptual problems. In doing so I was also trying to draw attention to arguments made by one prominent critic of the common genetic-deterministic interpretation of heritability coefficients, Peter Taylor, in this paper. I had noticed that others on this subreddit had been citing the work of Neven Sesardic to defend heritability and the way the concept is often used in the BG field. With this background established, I will quote from Kirkegaard's post:

"There’s a certain type of person that doesn’t produce any empirical contribution to “Reducing the heredity-environment uncertainty”. Instead, they contribute various theoretical arguments which they take to undermine the empirical data others give. Usually, these people have a background in philosophy or some other theoretical field. A recent example of this pattern is seen on Reddit, where Jinkinson Payne Smith (u/EverymorningWP) made this thread:

And then he quotes from the post I made that I was describing above. Honestly almost as surprising as him blogging about me is the fact that he knows my middle name. I must have posted it somewhere--I know it's on this blog, I guess some other places (Wikipedia, I think).

Here is what he says after quoting my post: "So: It works in practice, but does it work in (my) theory? These philosophy arguments are useless. Any physics professor knows this well because they get a lot of emails allegedly refuting relativity and quantum mechanics using thought experiments and logical arguments (like Time Cube). These arguments convince no one, even if one can’t find the error in the argument immediately (like in the ontological argument). It works the same way for these anti-behavioral genetics theoretical arguments. If these want to be taken seriously, they should produce 1) contrasting models, 2) that produce empirically testable predictions, and 3) show that these fit with their model and do not fit with the current behavioral/quantitative genetics models.

And then he calls me out by name! Specifically, he does so in the last paragraph of his post, which I have copied and pasted verbatim below:

"I must say that I do feel some sympathy with Jinkinson’s approach. I am myself somewhat of a verbal tilt person who used to study philosophy (for bachelor degree), and who used to engage in some of these ‘my a priori argument beats your data’ type arguments. I eventually wised up, I probably owe some of this to my years of drinking together with the good physicists at Aarhus University, who do not care so much for such empirically void arguments."

For a while I have been looking at many of the BG researchers focusing on genetics, race, IQ, etc. and I have suspected that they seem to really get off on using the word "empirical". This perception has only been bolstered by not only Kirkegaard himself, but also by many other people with whom I have been arguing about these topics on Reddit, as well as other articles I have read in the peer-reviewed BG literature.

One more thing: the point Kirkegaard made in the immediately above paragraph is reminiscent of a point someone else made on the same Reddit post that started all this. I don't remember who, but someone (maybe Kirkegaard himself) did mention physics and arguing that people can come up with silly theoretical concepts/thought experiments that seem to refute well-established theories in physics, but which collapse upon empirical scrutiny. Not knowing much of anything about physics, I am not going to dispute this point except to say that theoretical concerns are not necessarily invalid, nor are they necessarily trumped or refuted by statistics. Furthermore, it should be borne in mind that statistics or empirical evidence is not necessarily meaningful; it must be interpreted in a way that accurately reflects the underlying processes at work in what is being studied.

Thursday, January 10, 2019

Some hypothetical electoral maps

What would have happened in 2016 if every state had shifted from the 2012 election by the same amount it shifted from the 2008 election in 2012? 

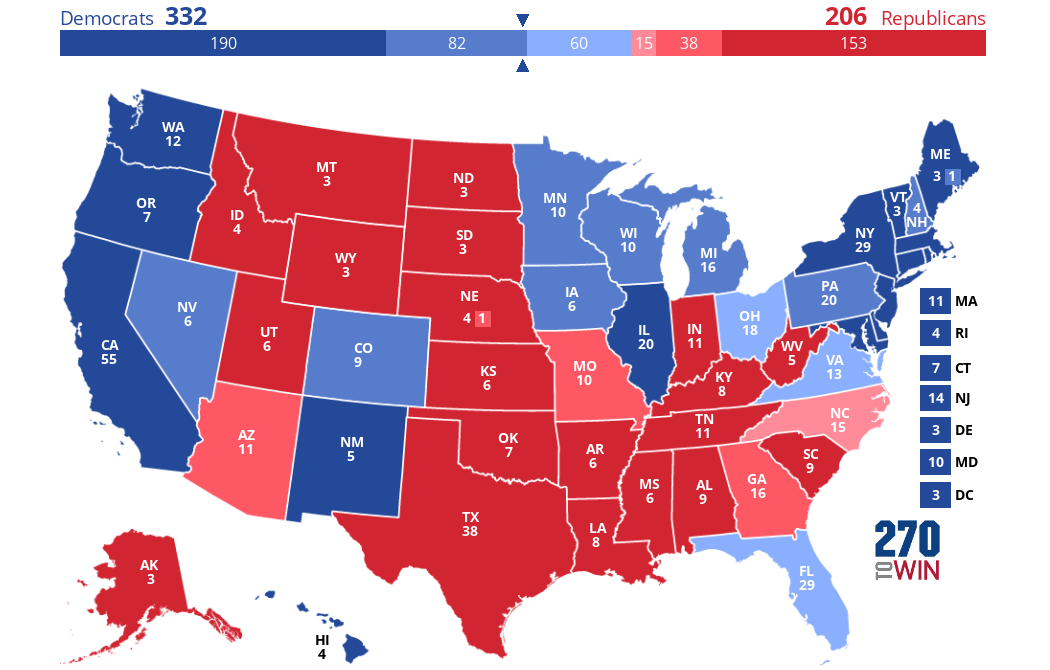
First, as a reference, let's look at the actual results of the 2012 election (taken from Wikipedia and made on 270towin.com):

In this map ("map #1"), all states that were won by the Democrat/Republican by <5 points are in light blue and light red, respectively. All states won by between 5 and 10 points are medium dark blue (e.g. Pennsylvania) or medium dark red/pink (e.g. Arizona). Finally, all states won by >10 points either way are solid blue/red. 

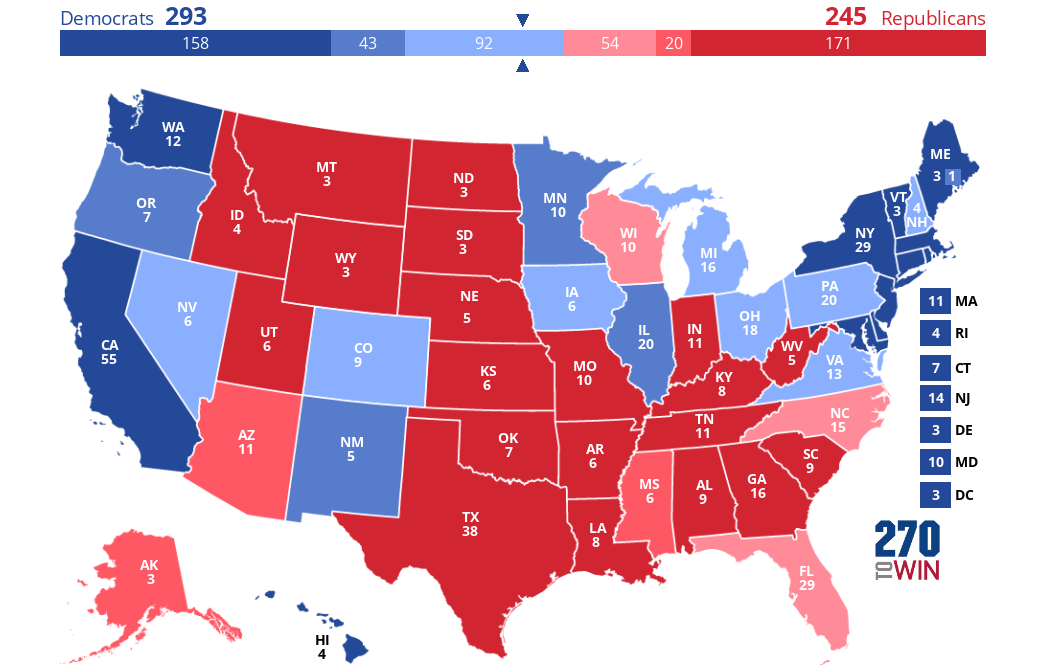
Anyway, what's the answer to the question in the first sentence of this post? What would the outcome of the 2016 election have been? To answer this question, I used data from Dave Leip's extremely useful Atlas of Presidential Elections and created this map (or "map #2"), also on 270towin.com (note that all subsequent maps are colored the same way as the first one):


So the answer, in short, is the Democrat wins the Electoral College 293-245. This would have represented the Democrat getting 57 more (and the Republican getting 57 fewer) electoral votes than their party's candidate actually did in 2016. Note that, although this is not shown in the map above, there are 3 states expected to have margins of <1% here (and which could thus be marked as tossups): WI, NV, and PA. 

Perhaps the most notable thing about this map is that, with respect to the party that wins each state, it is identical to the 2012 electoral map with only two exceptions: Florida and Wisconsin have both flipped from D to R. 

What else changes in this predicted map compared to the 2012 results? NV, CO, IA,  MI, PA, and NH all turn a shade lighter blue, while MO, GA, and the 2nd congressional district of NE all turn a shade darker red. Mississippi and Alaska both turn a shade lighter red because Obama did better there in 2012 than in 2008, to the extent that both states are expected to be won by the R candidate by between 5% and 10% in 2016.

Here are the states where the margin in 2016 is predicted to be <5% either way. States predicted to flip will be underlined from here on out.
Michigan
2.5%
Iowa 2.1%
Colorado 1.8%
New Hampshire 1.6%
Virginia 1.5%
Ohio 1.4%
Nevada 0.9%
Pennsylvania 0.5%
Wisconsin -0.1%
Florida -1.0%
North Carolina
-4.4%

Notably, in addition to mostly being similar to what happened in 2012, map #2 also comports pretty well with what actually happened in the 2016 election (i.e. Trump won both Florida and Wisconsin), except that he also won four additional pale blue states on this map (IA, MI, OH, and PA). He also won the medium-dark-blue 2nd congressional district of Maine by over 8%, though here it is predicted to go D by almost 6%, and Obama won it in 2012 by almost 10%! We also see that of these eleven states, Clinton won only four of them (CO, NH, VA, and NV).

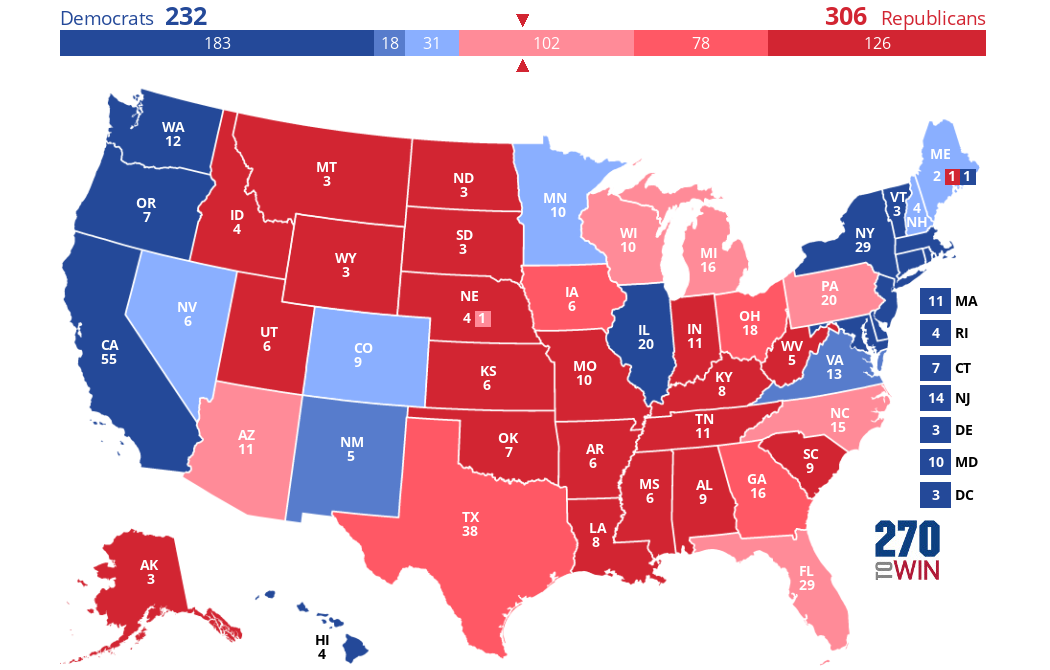
For comparison, I have illustrated the results of the 2016 election in the map below (map #3).


The fact that Trump won every state predicted to be won by the Republican in map #2, as well as 4 states (and 1 congressional district) predicted to go Democratic, further indicates that he did better (at least relative to Clinton) than one would normally expect, even accounting for the generally pro-R shift the country was already undergoing. 

In addition to the party differences noted above, here are also some shading differences between map #2 and the actual 2016 election (i.e. states that were predicted to be won by the correct party, but by a margin in the wrong color range) are as follows: 


  • MS and AK are medium-red on map #2, but both states were dark-red in 2016 (Trump won then both by >10 points). 
  • TX and GA are both dark-red on map #2, but both states were medium-red in 2016 (Trump won them both by between 5 and 10 points).
  • VA is light blue on map #2, but because Hillary won it by between 5 and 10 points, it was medium-blue in 2016.
  • ME is dark blue on map #2, but it should be light blue because Hillary won it by <5 points.
  • MN and OR are both medium-blue on map #2, but MN should be light blue and OR should be dark blue (Hillary won MN by <5 points and OR by >10 points).
  • AZ should be light red, not medium red (as it is on map #2), because Trump won it by <5 points.
  • NE's 2nd congressional district is dark red on map #2, but it should be light red, because Trump won it by <5 points.
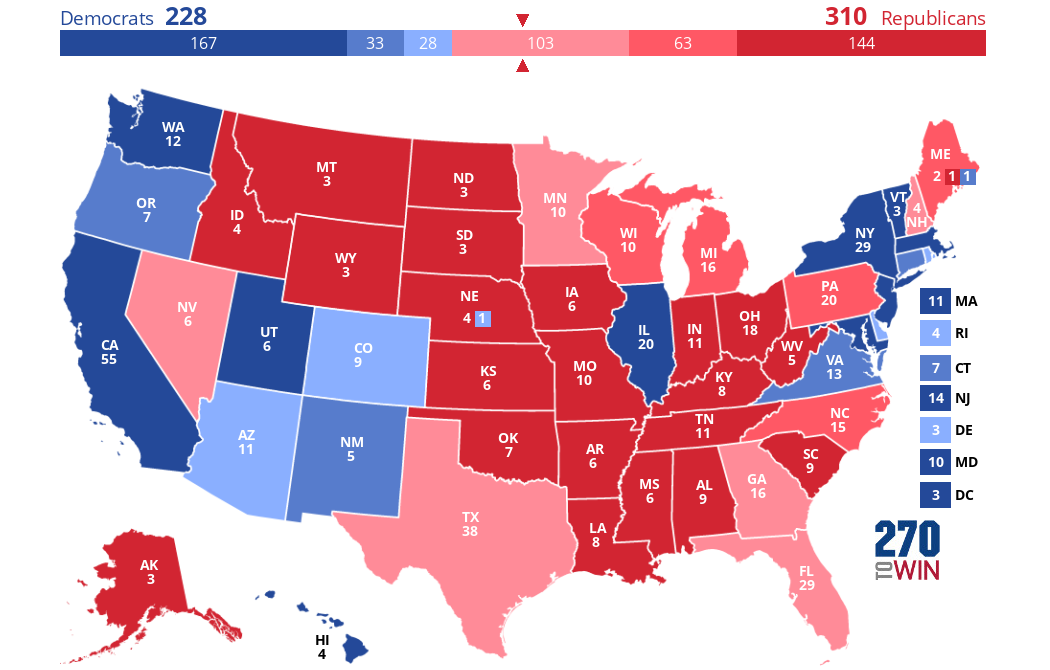
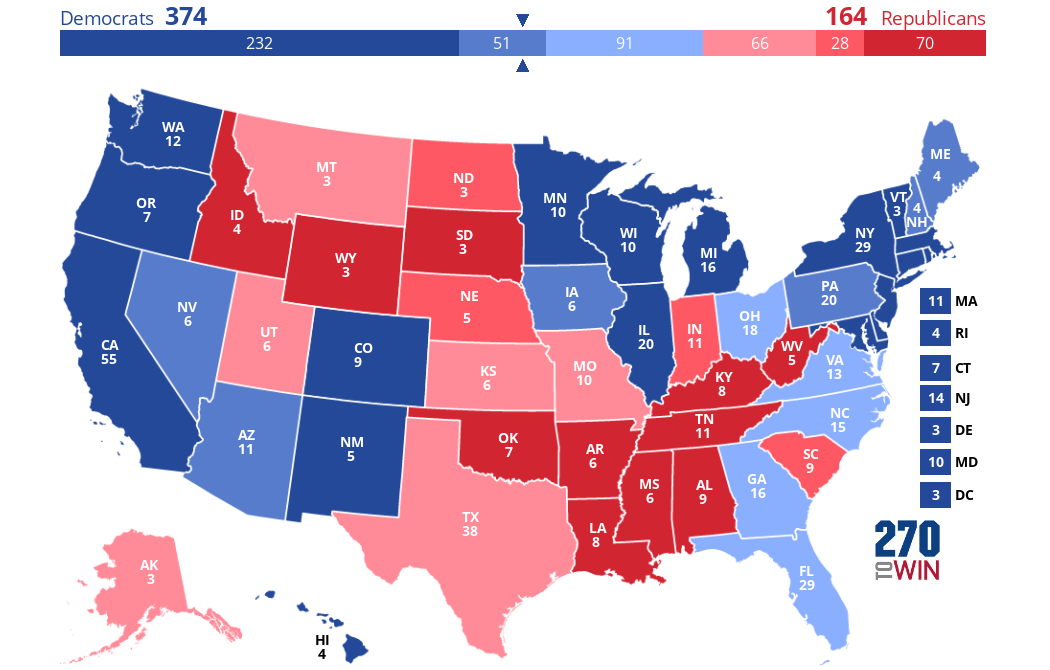
What about if the 2020 election was based on the shifts that happened from 2012 to 2016? Then this map (map #4) would be the result (same data sources and produced on the same website as above):
Weird fact: on the website the purple states were shown as having red and blue stripes. Adding the image through its URL here apparently changes the appearance of mixed electoral vote states for some reason. Anyway, here we see the Republican (presumably Trump) getting 310 electoral votes--four more than he got in 2016! This should not be a surprise because of course Trump did better than Romney in 2012, at least in most states; that's the reason he won when Romney didn't. In this map, four states are predicted to flip from D to R: Maine, Minnesota, Nevada, and New Hampshire. (Maine flipping means that Trump would win two of the state's electoral votes; he is also predicted to win its 2nd congressional district again, but to lose its 1st, which would give him 3 votes and the D candidate one vote from the state). Meanwhile, two states--AZ and UT--are predicted to flip from R to D, along with Nebraska's 2nd congressional district. 

Utah is a weird outlier on this map because it voted 30 points more Democratic in 2016 than in 2012. So if you take the result of the 2016 election in Utah (Trump wins by 18 points) and add 30 points in the D candidate's favor, this gives you a 12% D win, and since >10% margins here are shown in solid red/blue, Utah is solid blue on this map. But of course the odds of UT shifting 30% towards the Democrats again are pretty low, especially since Romney had no difficulty getting elected there last year. But then again, a recent poll suggests that a slight majority of Utah voters would not vote for Trump next November, so maybe it could happen: clearly voters there like Trump much less than normal establishment Republicans.

Some other weird facts about this map: 
  • Texas is expected to be really close: Trump is predicted to win it by only 2.2%, making it the second-closest state that he wins (behind only Nevada at 1.9%). 
  • Rhode Island is also predicted to be surprisingly close, with a D win predicted to be by only 3.6% (Trump shifted it way to the right in 2016). Delaware is a similar story (D expected margin of victory: 4.2%).
  • My own state, Georgia (along with Texas, also not typically considered a swing state), is expected to be closer than normal swing states like Florida and New Hampshire. This is caused by the fact that both GA and TX voted more Democratic in 2016 than in 2012--especially Texas, which swung almost 7% in the D's favor.
  • Ohio and Iowa, though long considered swing states, are both expected to be staunchly Republican in 2020--Iowa is predicted to be won by Trump by a larger margin than Mississippi, and Ohio is expected to be won by more than South Carolina!
The closest states (margins under 5%) are below (Trump wins red, D wins blue):

Colorado (4.4%)
Delaware (4.2%)
Rhode Island (3.6%)
Nebraska (2nd) (2.7%)
Arizona (2.0%)
Nevada (1.9%)
Texas (2.2%)
Georgia (2.5%)
Florida (3.3%)
Minnesota (4.7%)
New Hampshire (4.8%)

And finally, here is a map based on Trump's state-level net approval ratings (as of last month, according to Morning Consult). (Net approval rating = % who approve of Trump - % who disapprove.) Here, the coloring is the same as before, but I should note that if the approval rating was exactly + or -10%, it was placed in the "medium" color category (e.g. net rating of 10% = medium red, not dark red). This affected only two states: IA and NV (Trump's net approval rating was -10% in both states).
So, no surprise, Trump's approval ratings are net negative in every state he lost to Clinton in 2016. The (somewhat) surprising thing about this map is that they are also net-negative in nine states that he won in 2016: namely, AZ, FL, GA, NC, OH, PA, IA, WI, and MI. Of these, Trump's net approval rating is the lowest in MI and WI (both -12%!).

Tuesday, December 18, 2018

New paper: the accuracy of FiveThirtyEight's 2018 election predictions: an exploratory analysis

I submitted a paper with this title to SocArXiv, which you can read here in the unlikely event that you want to. (The content of that paper was originally posted here but it has since been removed, 'cause there's no need for it to be in 2 places at once.)

Friday, December 7, 2018

Stereotype accuracy part II

(Introductory author's note: all quotes in this post that I did not write will be in Courier font, but everything else will be in Times New Roman.)

In a previous post, I looked at the obviously fishy claims that Rutgers social psychology professor Lee Jussim and his colleagues (but especially Jussim himself) have been making regarding the purported accuracy of stereotypes. Before broadening this post to look at the many questionable arguments Jussim has made about many other topics, I will point out that Jussim's claim that stereotypes are usually very accurate (despite being false) has crept its way into a number of recent peer-reviewed papers that cite it as evidence of a supposedly widespread, structural bias in favor of liberal views in social psychology. Consequently, in this post I will critique some recent articles not written by Jussim or his colleagues, but which cite their research on stereotypes and portray it in a favorable light.

So first I need to sum up the argument being made by those advancing Jussim et al.'s claims about stereotype accuracy: ostensibly, there is overwhelming evidence that stereotypes are moderately to highly accurate, but liberal social psychologists (i.e. almost all social psychologists), blinded by their ideological preconceptions, refused to even approach or consider this evidence. Martin (2016), for instance, claims,


"...stereotype accuracy has been considered a taboo topic, and only a small number of researchers have investigated if stereotypes are accurate (e.g., Jussim 2012b). Much of this research has shown that stereotypes are indeed accurate (on average), particularly in direction. These findings contradict the assertion by some scholars that stereotypes primarily arise from intergroup envy or scorn (e.g., Fiske 2010). Rather, they develop from valid observations of the social world. Far from being the foolish mistake-makers that social psychologists have made them out to be (Baumeister 2010), humans are mostly perceptive observers. Were it not for the taboo against accuracy research, this scientific discovery might have occurred earlier."
Hoo boy, there's a lot of bullshit there! Firstly, we see the repeated victim mentality of anyone pushing a controversial claim that they claim is supported by strong scientific evidence: they are attacking their critics as motivated by political correctness and reluctant to even touch certain oh-so-controversial topics with a ten-foot pole because of their fear of "taboos". This is reminiscent of the argument style behavior geneticists often use, which also involves accusing their critics of political, rather than scientific, motivations. Aaron Panofsky's 2014 book Misbehaving Science refers to this style of (ad hominem) argumentation as "hitting-them-over-the-head" style. Panofsky states that the goal of this discursive style "...was not to seek synthesis, integration, or sober rational persuasion but to engage in polemical scientific attack, declaring themselves as crusaders who would rout the antigenetics heresy gripping behavioral science" (Panofsky 2014, p. 142).

In the field of behavior genetics (BG), this style of argumentation often manifests as behavior genetics researchers calling their critics "blank slatists", or saying they have some sworn ideological allegiance to total environmental determinism/the standard social science model when explaining human behavior. This lets BGists portray themselves as offering the reasonable idea of maybe letting genes be part of the equation that leads to human behavioral traits, as an alternative to those nutjobs who want to pretend that human genes and evolution don't even exist. Here we see Martin similarly using this approach to avoid addressing specific points made by one's critics, and instead trying to elicit sympathy from readers by portraying the author as under attack by the PC brigade that supposedly controls the vast majority of academia.

Where was I? Oh yeah, Martin's article. Martin was saying that the idea of stereotypes being accurate a) could've been researched empirically for a long time, but b) wasn't researched empirically nearly as often as it could have been, because c) almost all social psychologists were blinded by the taboo against such research by their supposedly all-encompassing liberal ideologies. Further, he claims that d) when a handful of brave, Galileo-like mavericks finally stood up to the leftist cabal that rules almost all of the social psychology field with an iron fist, e) they proved that stereotypes are actually very accurate, on average, which f) proves that stereotypes arise from accurate perceptions of reality, not prejudice.

Before addressing these arguments I want to point out another fundamental issue with the "stereotypes are accurate" argument I did not mention in my previous post on Jussim's work in this area. Specifically, as Jussim himself acknowledges, there is not a single dimension of "accuracy" on which a perception or belief can be assessed, but rather several possible "scales" on which one may attempt to do so. In a 2015 journal article, for example, Jussim et al. note that there are two distinct ways that stereotype accuracy can be assessed. These two ways are discrepancy scores and correspondence. As Jussim et al. further explain,
"One method of assessing accuracy is not “better” than the other; each contributes unique information (Jussim, 2012; Ryan, 2002). Discrepancy scores indicate how close perceivers’ stereotypes come to being perfectly accurate (scores of 0 reflect perfect accuracy). Correspondence indicates how well people’s beliefs covary with criteria" (Jussim et al. 2015, p. 492). 
So it would behoove those who want to make confident claims about the "accuracy" of stereotypes to make sure that they use both methods (or take into account studies that do so) before concluding that stereotypes are either accurate or inaccurate. So surely, when Jussim et al. (2015) claim in their paper's abstract that the accuracy of stereotypes is "one of the largest and most replicable findings in social psychology", they are basing this on both types of studies, right? This is not at all the impression you get from their table 2, which claims to present, and I am not making this up, "Stereotype Accuracy Correlations From Over 50 Studies Showing That Stereotypes Are More Accurate Than Social-Psychological Hypotheses". They appear to only be paying attention to correlations between perceived and actual group characteristics, without paying attention to discrepancy scores, in coming to the obviously provocative conclusion that stereotype accuracy is actually greater than that of social psychological hypotheses collectively. That being said, they do acknowledge the existence and results of discrepancy-score studies bearing on this topic, e.g. when they say "Although not every study examined discrepancy scores, when they did, a plurality or majority of all consensual stereotype judgments were accurate. For example, an international study of accuracy in consensual gender stereotypes about the Big Five personality characteristics found that discrepancy scores for all five reflected accuracy (Lockenhoff et al., 2014)." However, it should be pointed out that it is more difficult to assess the relative "accuracy" of psychological hypotheses and stereotypes when the latter are assessed based on discrepancy scores (e.g. 1 SD) rather than correlation coefficients. Further, the statement that Lockenhoff et al. (2014) "found that discrepancy scores for all five reflected accuracy", referring to the Big Five model of personality traits (Neuroticism (N), Extraversion (E), Openness to Experience (O), Agreeableness (A), and Conscientiousness (C)), seems to be rather at odds with the following quote from that very paper (Lockenhoff et al. 2014, p. 685): "Across all facets of N (and for N1: Anxiety in particular), assessed sex differences appeared to be more pronounced than GSDs [gender stereotype differences], and this was true for both self-reports and observer-ratings.

Though the above points I made seem troubling (though I'm hardly an impartial judge of how compelling my own  arguments are), I think that the biggest problem with this research is that, ironically, it stereotypes stereotypes themselves by referring to them in blanket terms as "accurate". This ignores not only the highly problematic nature of referring to entire groups as all possessing a characteristic without acknowledging variation within groups on that characteristic, but also the fact that even by these researchers' own criteria, some stereotypes are decidedly inaccurate. Political stereotypes, for instance, were said to "exaggerate group differences" by Jussim et al. (2015). In addition, these authors note that "Empirical reports based on independent samples from around the world (e.g., McCrae et al., 2013) have consistently found little national-character stereotype accuracy".  Consequently, blanket statements about the "accuracy" of stereotypes serves to commit the very fallacy of generalization that psychologists have been criticizing stereotypes for for decades now: it ignores that not all members of group x (in this case, stereotypes) have characteristic y (in this case, accuracy).

Sources
Jussim et al. 2015
Lockenhoff et al. 2014
Panofsky 2014
Martin 2016

Wednesday, October 31, 2018

Gottfredson vs. Gottfredson

I'd like to introduce you to Linda Gottfredson, former professor of educational psychology at the University of Delaware and recipient of her very own page on the SPLC's "fighting hate" website. But if you've been reading this blog for long enough you'll already have seen me talk about some of Gottfredson's work. Specifically, last July I critiqued an article she wrote in 2013 lavishing praise on racialist psychologist J. Philippe Rushton and disparaging his detractors. But here I wanted to look at her work in "g theory" over a long period of time and try to understand exactly what she thinks about the topic.

Brief overview before I start: g theory is based around the idea that there is a single "general intelligence", aka g (note italics: that's important), that IQ tests measure (though of course some better than others). The evidence for the existence of this g (aka "g factor" or "general factor") is said to be, above all else, the positive correlations between scores on different types of cognitive ability tests--even those that are very different in their scope and subject matter. g theorists thus tend to talk about people who are very intelligent as having high levels of g, and vice versa, thus implicitly assuming that "intelligence" can be "objectively determined and measured" by IQ tests in all people everywhere in the world with no exceptions. (The "objectively determined and measured" quote is a reference to the 1904 article by psychologist Charles Spearman that started this "theory".)

So I wanted to start by trying to answer this question: does Gottfredson believe that IQ/g is a fixed quality that cannot be changed by environmental interventions, or does she acknowledge that people are not born with a fixed, immutable quantity of intelligence, and that they can be made smarter by certain environmental interventions and changes? Let's try to look at some quotes from her previous writings to get an answer to this question (all emphases are mine):

Gottfredson (1994, p. 15): "That IQ may be highly heritable does not mean that it is not affected by the environment. Individuals are not born with fixed, unchangeable levels of intelligence (no one claims they are)." 

Gottfredson (2000): "“Genetic” does not mean “fixed” or “unchangeable.” Just as genetically caused differences are not necessarily irremediable (consider diabetes and poor vision), environ­mental effects are not necessarily reversible (consider lead poisoning and head injuries). Both sources of low IQ may be preventable to some extent. Genetic screening and gene therapy, for instance, are both intended to prevent genetic disorders such as mental retardation."


Gottfredson (2003, p. 114): "No g theorist claims that g is “fixed.” This is a canard and distracts readers from the pertinent point, which is that individual differences in g become highly stable and more heritable by adolescence." 


Gottfredson (2009, p. 415): "...if you state that people’s IQ scores are stable over time or highly genetic (both true), many people will hear you claiming that intelligence level is fixed in stone from birth (false)—unless you anticipate and correct that common misunderstanding."


Seems clear enough. Linda Gottfredson doesn't think that someone's IQ/intelligence/g is a fixed number, as is evident from all of the quotes cited above. In other words, it appears that she is willing to acknowledge the malleability of intelligence with respect to social/educational interventions. But perhaps she actually believes the exact opposite: that intelligence (i.e. IQ score) is a fixed, genetically determined quantity that we can't significantly change. Don't take my word for it, though; listen to what she herself says in the very sources I quoted above: 


  • "IQs do gradually stabilize during childhood, however, and generally change little thereafter." (Gottfredson 1994, p. 15)
  • "There is no effective means, as yet, for raising low IQs permanently." (Gottfredson 2000)
  • In the two other quotations above (from 2003 and 2009), you see her talk about how g (aka general intelligence) is "(very) heritable", "highly stable", and "highly genetic". But does that mean it's fixed, or that policy makers shouldn't even bother to change it with programs like Head Start? Well, she herself provides us with a clear(-ish) answer to this question in a 2005 paper in which she stated:
  • "Jensen’s 1969 conclusion about the failure of socioeducational interventions to raise low IQs substantially and permanently still stands" (Gottfredson 2005, p. 313). This is a reference to the (in)famous paper by Jensen in the Harvard Educational Review that really got the genetic-determinist black-IQ-inferiority "debate" started 49 years ago. 

So in practice, she is saying that people's IQs tend to stay at about the same value (after childhood, anyway), even though in theory, she acknowledges that this doesn't have to happen. And in her 2000 article that I cited above, she further says that we might be able to raise people's IQs by saying, "Both [genetic and environmental] sources of low IQ may be preventable to some extent", but then switches from theoretical optimism to supposedly realistic pessimism by saying we can't currently do it permanently (or at least we couldn't in 2000).

And in 2016, she wrote, "Were the distribution of g unstable or malleable, g's effect sizes for various types of performance and life outcomes would not remain so regular, so consistent, so patterned decade after decade at the population level (cf. Gordon, 1997)" (Gottfredson 2016, p. 125; emphasis in original).


Ugh, so confusing. IQ is malleable, but it isn't, at least not by any method that exists now? I wonder which Linda Gottfredson we are to believe? This kind of ambiguity is brought to you by what Howard Gardner dubbed "scholarly brinkmanship": going really close to an extreme conclusion, very strongly implying it, but being careful not to directly state it. Here we see Gottfredson engaging in scholarly brinkmanship with regard to the idea of genetic determinism of people with low IQ and society's putative inability to do anything about it (aka "genetic fatalism", Alper & Beckwith 1993).


There's more where that came from: she often emphasizes that research on the supposed genetic basis of black-white IQ differences doesn't necessarily have any policy implications: 

Gottfredson et al. 1997 (p. 15): "The research findings neither dictate nor preclude any particular social policy, because they can never determine our goals. They can, however, help us estimate the likely success and side-effects of pursuing those goals via different means."

So she says that this research is only relevant to social policy in that it can shed light on how effective certain programs would be at achieving goals, but it can't help us make the (obviously subjective) decisions of what our goals should be. But the disingenuous part of this is that IQ-genetics-race research "neither dictate[s] nor preclude[s] any social policy"--because I can think of someone who would not agree with that statement. In fact, this person believes that research "showing" that racial IQ differences are mainly due to genetics does demonstrate that certain social policies will be doomed to fail. This person has written sentences like the following:
Much social policy has long been based on the false presumption that there exist no stubborn or consequential differences in mental capability. Worse than merely fruitless, such policy has produced one predictable failure and side effect after another, breeding widespread cynicism and recrimination...Civil rights advocates resolutely ignore the possibility that a distressingly high proportion of poor Black youth may be more disadvantaged today by low IQ than by racial discrimination, and thus that they will realize few if any benefits (unlike their more able brethren) from ever-more aggressive affirmative action [Emphasis mine].*
And:

...social science and social policy are now dominated by the theory that discrimination accounts for all racial disparities in achievements and well-being. This theory collapses, however, if deprived of the egalitarian fiction, as does the credibility of much current social policy.** 
You'll never guess who the person is who wrote these statements--unless you have been paying even a modicum of attention to the previous parts of this post, or if you skipped ahead to the footnotes from the asterisks. In either case it should be obvious that Gottfredson wrote both of the above passages. This supports the point that the SPLC made on their "Extremist Files" profile of her:
She concludes “Mainstream Science” by claiming that her ideas “neither dictate nor preclude any social policy.” But much of her career has been dedicated to the idea that because IQ determines social outcomes, and racial disparities in IQ are innate and immutable, policies intended to reduce racial inequality are doomed to fail, and may even exacerbate the problems they’re intended to remedy.

*Gottfredson 1997, p. 124-5
**Gottfredson 1994, p. 55