Friday, May 31, 2019
Moving to Medium
I will now only be posting on Medium from now on, rather than here, so click here if you want to read any of my future posts. My previous posts will still be available here though.
Tuesday, May 28, 2019
Relationship between poll quality and President Trump's (dis)approval rating
Background: President Trump often touts Rasmussen approval rating polls that give him relatively favorable ratings (e.g. [1], [2]). Critics have responded by arguing, among other things, that "Rasmussen's polling has consistently been higher than other polls in evaluating approval for Trump" [3]. This hypothesis was systematically evaluated in the current analysis, as was the hypothesis that higher-quality polls (as measured by FiveThirtyEight's rating system) tended to give the president higher/lower (dis)approval ratings, on average.
Methods: Trump presidential approval rating polling data was downloaded from this link (by clicking on the link labeled "presidential approval polls" at the bottom). Data were then analyzed to calculate average approval and disapproval ratings for polls with a) a specific letter grade from FiveThirtyEight, b) Rasmussen, and c) just all polls overall, to test for relationships of poll characteristics with the result.
Results: The average approval rating and disapproval rating across all polls was 42% and 54%, respectively. Letter grades for polls by agencies that had such grades assigned to them ranged from a minimum of D- to a maximum of A+. When grades were converted into a numerical score (D- = 1, then increasing by 1 more point for each letter-grade tier (D = 2, D+ = 3, C- = 4, etc.)), there was a strong negative correlation between letter grade and approval rating (r = -0.74), while the correlation between letter grade and disapproval rating proved to be very weakly positive (r = 0.06). There was also a fairly strong negative correlation between letter grade and net approval rating (the latter being % approval - % disapproval; r = -0.60). In addition, Rasmussen did indeed tend to produce higher average approval ratings for Trump than the average of all polls combined (47% vs. 42%), and it also produced lower average disapproval ratings (52% vs. 54%). Trump's average approval rating based only on the highest quality polls (A+ grade) is 41% and his disapproval rating based on such polls is 53%. Notably, this is also based on polls conducted during his entire presidency (so far); as such, it is unsurprising, but reassuring, that the average approval rating of 41% matches closely with the average of 40% estimated by Gallup.
Conclusions: I found strong evidence that higher quality polls tend to produce lower approval rating and net approval rating estimates, but no such effect was found for disapproval ratings, which tended not to systematically vary with FiveThirtyEight quality rating. On average, a 1-point increase in poll quality rating is associated with a 0.48% point decrease in Trump approval rating. Furthermore, I corroborated previous reports indicating that, on average, Rasmussen polls tend to lead to higher approval ratings for Trump (as well as lower disapproval ratings).
Thursday, May 23, 2019
Jerry Coyne's strategies on evolutionary biology
How does Jerry Coyne on his blog respond to (he would probably say "refutes") claims that we need to change the gene-centered neo-Darwinist view of evolution because of epigenetics and other phenomena? Of course there's more than one answer you can find from posts on his blog. But here are a few recurring ones:
- Ad hominem fallacy: Researchers arguing for the EES and/or a significant role of epigenetic inheritance are biased because they are funded by the Templeton Foundation, whose underlying ideological bias against old-school neo-Darwinism presumably invalidates all research ever funded by them. E.g. "[Proponent of epigenetics Michael] Skinner is eating well from the Templeton trough. It’s pretty clear that Templeton is deeply invested in showing that the “conventional” view of evolution and genetics is wrong, for they’ve also put millions into other researchers to that end."
- More ad hominems include: researchers being biased to exaggerate their conclusions because they want media attention for their claims of a paradigm shift, papers pushing transgenerational epigenetic inheritance are only published because of stupid biased scientists who have an unshakeable belief in this (presumably nonexistent) process, the media and the public's affinity for epigenetics stories, etc.
- Epigenetics is still fundamentally under genetic (DNA) control, so DNA-centrism is still valid. E.g. "the position of and influences on a cell can cause it to acquire methylation marks that turn it into difference courses of development: a liver cell, a kidney cell, a bone cell, and so on. But these changes, all inherited among cells in a single body, have resulted from natural selection: they’re adaptive because having different kinds of cells and tissues is adaptive. What has happened is that the DNA program itself, within the egg, contains information that says “methylate cell X at genes Y and Z if it experiences condition C”, and so on."
- Epigenetic inheritance doesn't last long enough to cause long-term evolution: "...we have no examples of such acquired methylation lasting more than two or three generations, so there’s no evidence that it could serve as a stable basis of inheritance, much less of adaptation."
- Studies supposedly showing that such inheritance exists are "...more often than not flawed, relying on p-hacking, small sample sizes, and choosing covariates, like sex, until you get one that shows a significant effect".
One especially absurd DNA-centric claim Coyne has made which I couldn't believe when I first read it is: "All heritable differences between species, in fact, must reside in the DNA; we know of no cases in which they don’t. Where else could they be?"
I'm sorry, what? We already know more genes doesn't mean more complexity in organisms, so clearly the differences in gene regulatory networks rather than the genes themselves are what really matter in distinguishing species. Rejecting the idea that genes determine phenotypes is crucial to explaining how humans are different from flies/worms/other organisms w/about the same number of genes. "...the amount of direct genetic information present in, say, the human genome (now estimated to be around 30 000 protein-coding genes) is orders of magnitude below what would be necessary to actually specify the spatial location, functionality and connectivity among the trillions of cells that make up a human brain. The answer must be in the local deployment of information that is possible through developmental processes, where the ‘instructions’ can be used in a way that is sensitive (and therefore capable of adjusting) to both the internal and external environments." Moreover, DNA is not the only biological way (not even counting cultural transmission) for information to be inherited.
OK, so what if 3 is true but 4 is false? "...a methylation-sensing gene regulatory circuit centered on a 5-methylcytosine DNA glycosylase gene is required for long-term epigenetic fidelity in Arabidopsis." So you need DNA to make epigenetics stable across generations. But we see Coyne has created a way to potentially disprove him: you would need to show that epigenetics is stable over "more than two or three generations". Of course he claims no one has done this yet, or if they have it's Templeton-funded p-hacking media-attention-seeking garbage, but is this true? To quote the paper I linked to at the top of this paragraph, "In plants, DNA methylation patterns are faithfully inherited over many generations", and we also know this can happen in yeast too. So clearly Coyne is at least slightly wrong. Sometimes critics of this concept will claim it is valid, but only in non-mammal organisms, a view Coyne seems to share, yet again superficially dismissing studies contradicting this view by collectively accusing them of a smorgasbord of different methodological flaws. But of course he couldn't be bothered to go into detail about what these fatal flaws are in each study.
Tuesday, May 21, 2019
A meta-analysis of Joe Biden's support in primary polls.
Update: This meta-analysis is no longer being updated, so "regularly updated" has been removed from the title of this post.
This post outlines the methods and results of a simple meta-analysis of the % support received by Joe Biden in national 2020 Democratic primary polls. Currently, the meta-analysis includes 125 polls, all national polls obtained from FiveThirtyEight's poll aggregator. The effect size is the % of the vote Biden gets in a given poll, and the sample size is just the number of people polled. These polls included a total of 324,920 people. The meta-analysis was carried out in keeping with the instructions outlined here.
Note that I have only ever added polls to this meta-analysis, with one exception: an open-ended ABC/WaPo poll that I removed because it had an unusually high percent of respondents (35%) who said they were undecided, which also resulted in all the candidates' percentages being significantly deflated.
Due to high heterogeneity (I2 = 94.8), a random-effects meta-analysis was performed, yielding an effect summary of 30.5% (95% CI 29.6% - 31.4%). No evidence was found that smaller-sample polls were biased in Biden's favor: on the contrary, there was a moderate positive correlation between sample size and % support for Biden (r = 0.36).
Monday, May 20, 2019
Candidate-specific swing maps from 2016
The map below shows where Trump got a lower % of the vote than Romney (by >1%) in blue and higher % in red. If the diff. is <1% either way, the state is gray. Darkest shade = >10%, then 5-10%, then 3-5%, then 1-3% in decreasing order of darkness/solidness.
What about where Clinton got a higher % of the vote than 2012 Obama (same rules of course, but w/colors reversed regarding higher/lower)?
 This underscores how the 2016 election was indeed a Clinton loss more than a Trump win. Clinton lost a lot more ground in more places than Obama compared to Trump improving on Romney.
What about where Clinton got a higher % of the vote than 2012 Obama (same rules of course, but w/colors reversed regarding higher/lower)?
Monday, March 18, 2019
On the representativeness of exit polls II: the 2018 gubernatorial elections
In my own state, Georgia, Kemp won the governor's race with 50.2% of all votes cast, to Abrams' 48.8%. Using CNN's exit poll to estimate the results yields the following estimates for the gender exit poll:
Kemp = (.52*.46)+(.49*.54) = 50.4%, so 0.2% high.
Abrams = (.46*.46)+(.51*.54) = 48.7%, so 0.1% low.
For age (4):
Kemp = 49.9%, so 0.3% low.
Abrams = 48.8%, so exactly right.
For age (6):
Kemp = 49.7%, so 0.5% low.
Abrams = 48.0%, so 0.8% low.
Using the Excel spreadsheet I just threw together it is easy to calculate estimates for any race if you have the exit poll results (% of voters in each group and voting results by group). If you do it for the FL governor's race (won 49.6%-49.2% by the Republican Ron DeSantis; CNN's exit poll is here), you get this:
Gender: DeSantis = 49.8% (0.2% high), Gillum 48.7% (0.5% low).
Age (4): DeSantis = 49.9% (0.3% high), Gillum 48.8% (0.4% low).
Age (6): DeSantis = 49.0% (0.2% low), Gillum 48.3% (0.9% low).
For this Age (6) poll, the probable reason the estimates for both are a bit low is that 4% of 30-39 year old voters responded "No Answer" when asked who they voted for. Was this because they voted for a third-party/independent candidate, or did they not vote (for governor at least) at all? Probably a combination of both, but some of them probably just didn't answer even though they actually voted for DeSantis or Gillum.
CA: Democrat Newsom won the governor's race in CA with 61.9% of the vote to 38.1% for Republican Cox. Notably, it seems like these were the only two candidates on the ballot because of CA's weird runoff system, so 100% of all votes were for one or the other. Because some exit poll results have at least 1% of respondents refusing to answer we have to make all percentages based on the % of respondents who did answer (100%-the % who didn't answer).
Using CNN's exit poll for that state yields these estimates for the results (all errors are +/- based on value of (estimated-actual)):
Gender: Newsom 60.9% (-1%), Cox 39.1% (+1%)
Age (4): Newsom 60.8% (-1.1%), Cox 39.2% (+1.1%)
Age (6): Newsom 60.7% (-1.2%), Cox 39.3% (+1.2%)
If only X could vote
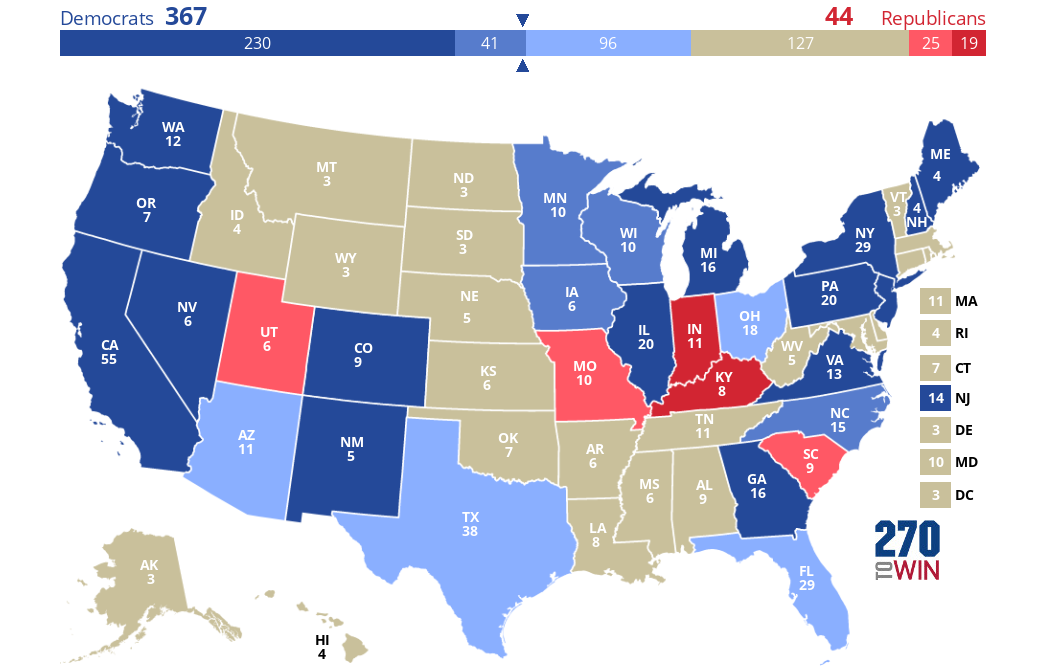
Based on CNN's exit polls from the 2016 election by state, in the states where these polls were conducted, here are what the results of elections would have been if only members of group X could vote. Light color (red/blue) = less than 5% win, medium = 5-10% inclusive, and dark = 11% or more (if a state margin is between 10 and 11%, it will be medium color; this only applies to Oregon in the first map).
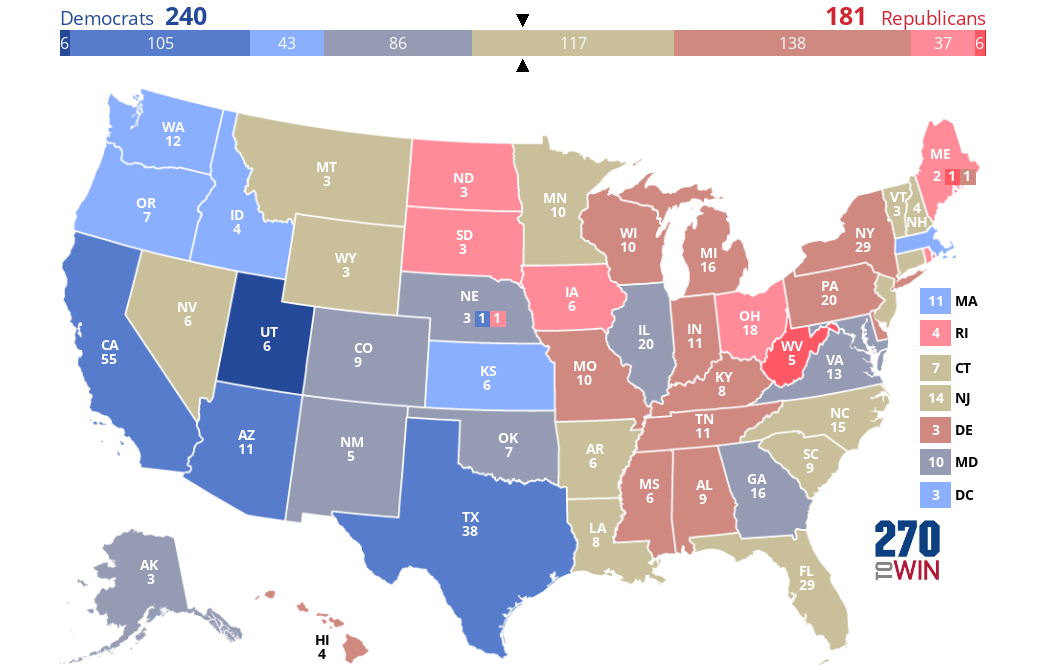
Let's start by taking the actual 2016 EV results (recall they were 306 Trump, 232 Clinton) and grey out all the states that CNN does not have exit polls at all for. As you can see plenty of states are grayed out--mostly ones Trump won in the Great Plains/Western area, as well as some Trump-loving southern states and a few liberal ones in the Northeast. The 2016 exit poll included 28 states, excluding 22 states and DC. In total, we see Trump with 224 EVs and Clinton with 187, so no one has enough to win here:
Note that in the hypothetical scenarios below I will be giving all of Maine's 4 EVs to the same candidate (even though this might not actually happen, and didn't actually happen in 2016).
If only men could vote, Clinton would lose 62 EVs in these states, and would win only 125 EVs. Trump, meanwhile, would gain all 62 of these EVs and be able to win the Electoral College even without the excluded states (most of which he actually won anyway). These Trump gains/Clinton losses come from Minnesota, Nevada, Washington state, Colorado, New Mexico, Maine, New Hampshire, and Virginia--Clinton won all of these states but more men voted for Trump than for her in each of them:
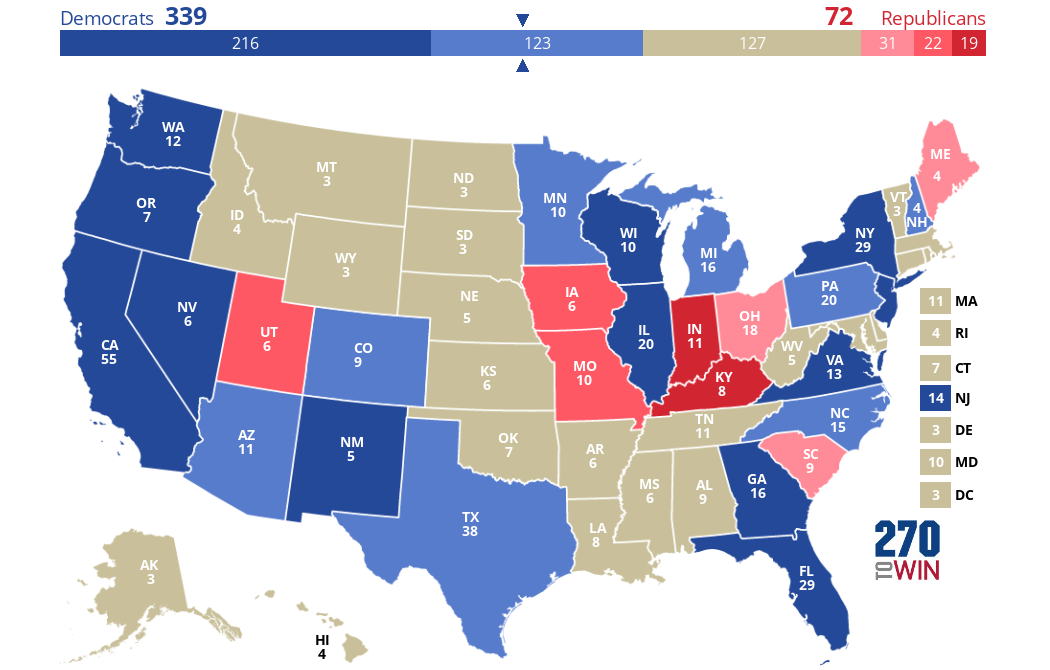
Let's start by taking the actual 2016 EV results (recall they were 306 Trump, 232 Clinton) and grey out all the states that CNN does not have exit polls at all for. As you can see plenty of states are grayed out--mostly ones Trump won in the Great Plains/Western area, as well as some Trump-loving southern states and a few liberal ones in the Northeast. The 2016 exit poll included 28 states, excluding 22 states and DC. In total, we see Trump with 224 EVs and Clinton with 187, so no one has enough to win here:
But if only women could vote, unsurprisingly, Clinton would do extremely well, flipping many states Trump won and getting a whopping 367 EVs:
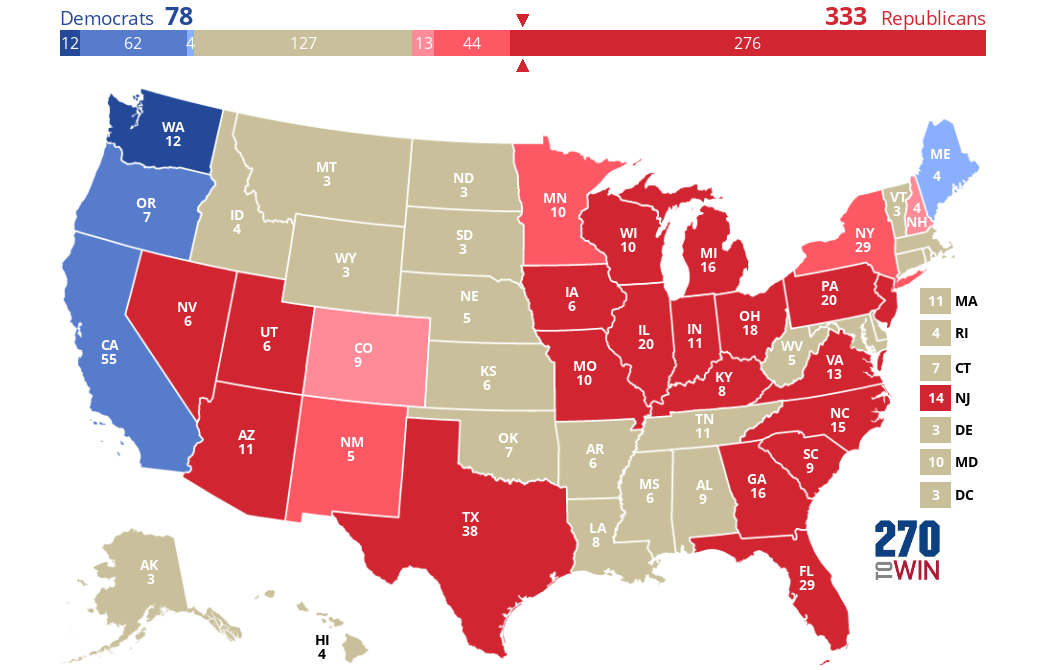
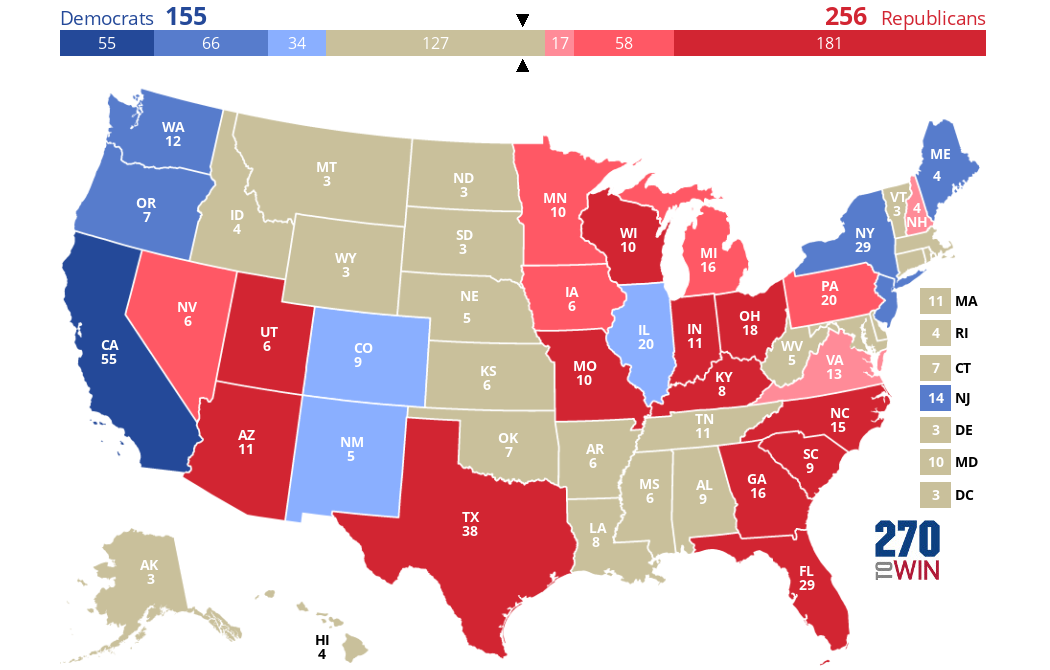
If only white people could vote, the results would be even more favorable to Trump than they were with men. Clinton would hang on to ME and WA, but lose NY, NJ, and even her birth state of IL! The result would be Trump getting a whopping 333 EVs, way more than enough to win:
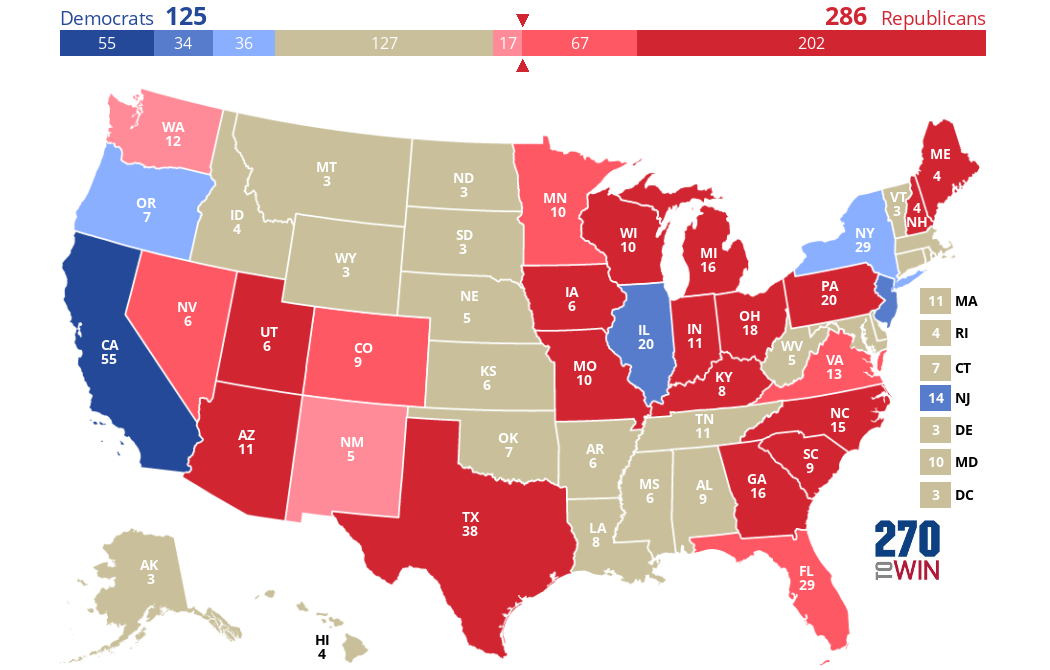
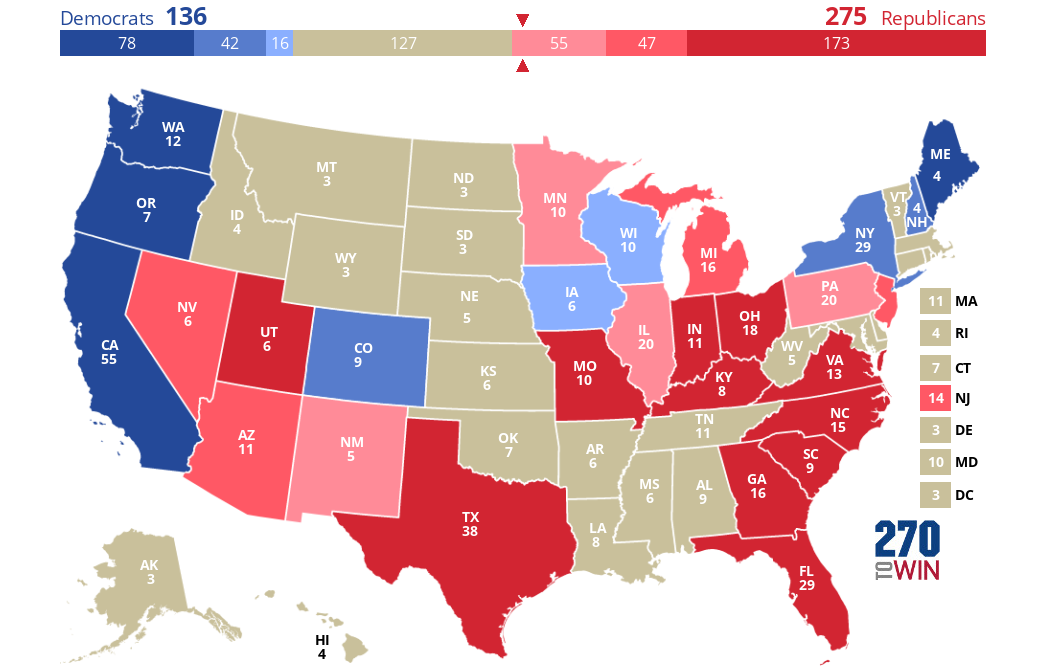
What about if only white women could vote? We've heard a lot about white women since 2016 because most of them voted for Trump that year (despite most women in general voting for Clinton, as usual for Democratic candidates). The results reveal some strange patterns: some states flip in Clinton's favor (IA and WI) compared to the actual results, while other states (e.g. NJ, MN, and IL) actually flip the other way. In all, Trump gets 275 EVs, just enough to win, and Clinton only gets 136. This represents a Republican gain of 51 EVs compared to the actual results (again only based on the states w/exit polls):
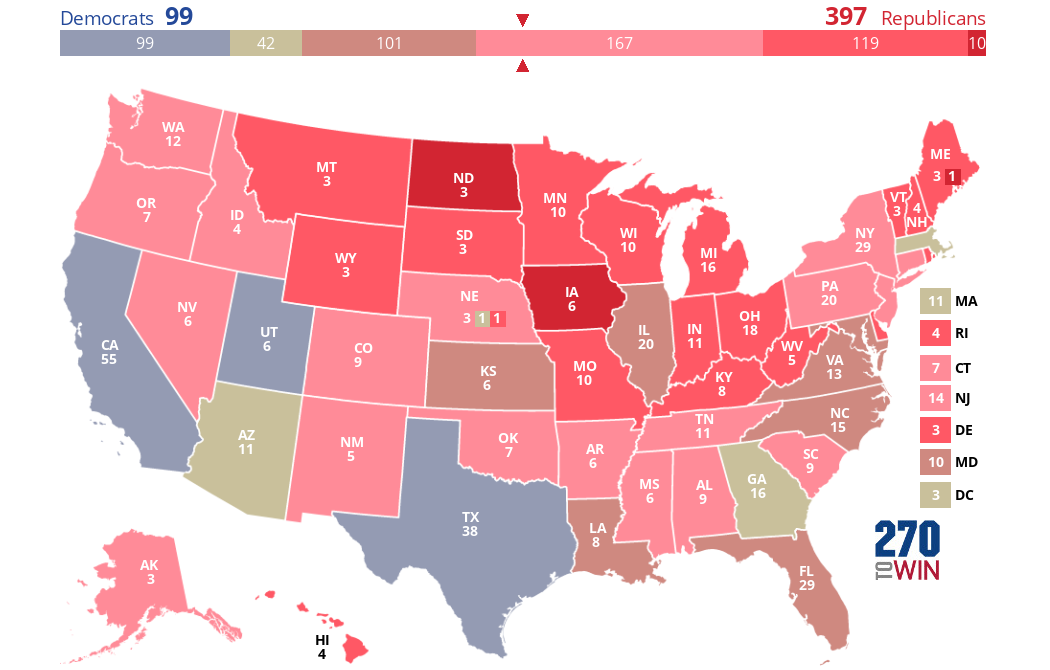
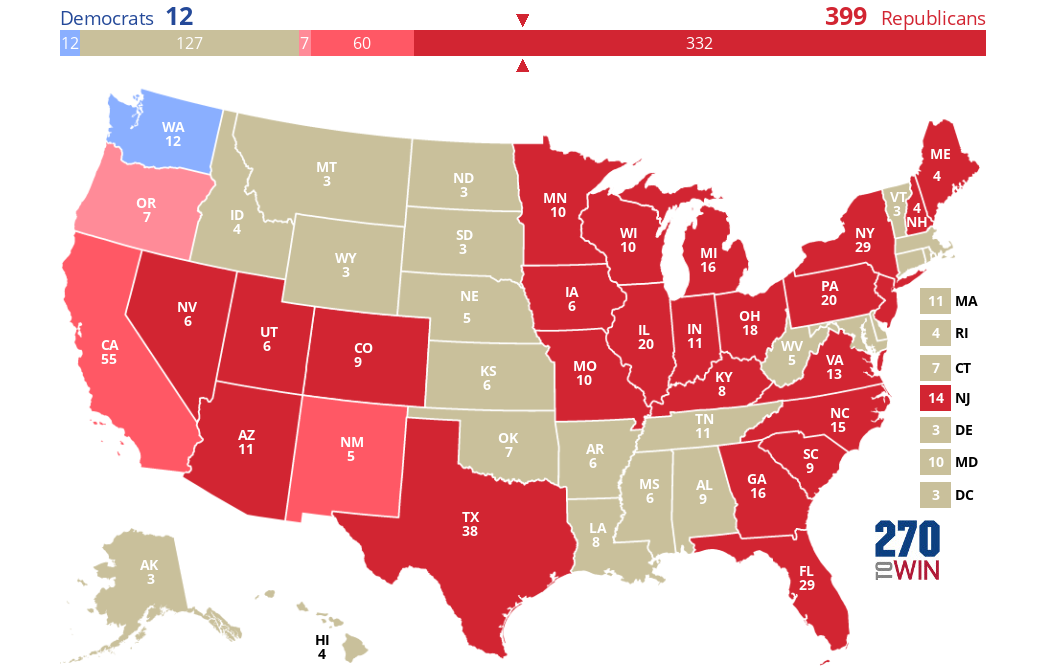
Also, it seems obvious that if only white men could vote, Trump would absolutely crush Clinton almost everywhere, no? Indeed he would have, and the result is so lopsided even I was surprised by it:
Yes, you're reading that right: the only state (included in CNN's exit polls) where more white men voted for Clinton than Trump is Washington state! So of course Trump would win easily in this scenario, with a whopping 399 EVs compared to only 12 for Clinton.
If only people aged 18-45 could vote, Clinton, no surprise, would do very well, winning all but 8 states included here. This would result in her getting 339 EVs, 152 more than she actually got in the included states. Oddly, one state would actually flip from Clinton to Trump if only those under the age of 45 could vote: Maine.
But if only people 45 or older could vote, we would see Clinton lose a bit of ground relative to her real performance.
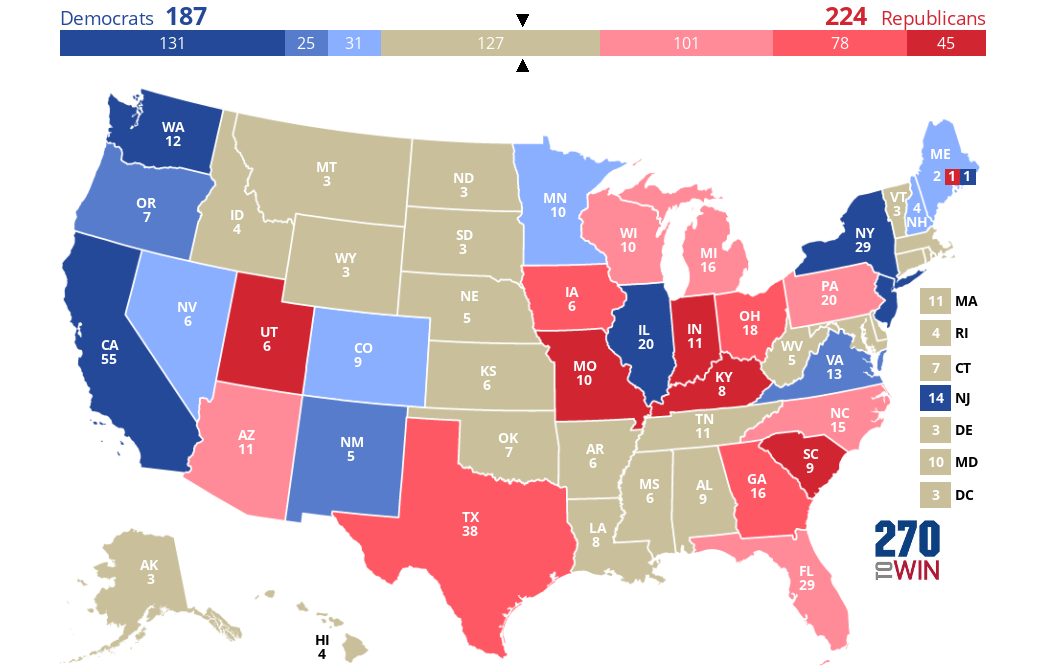
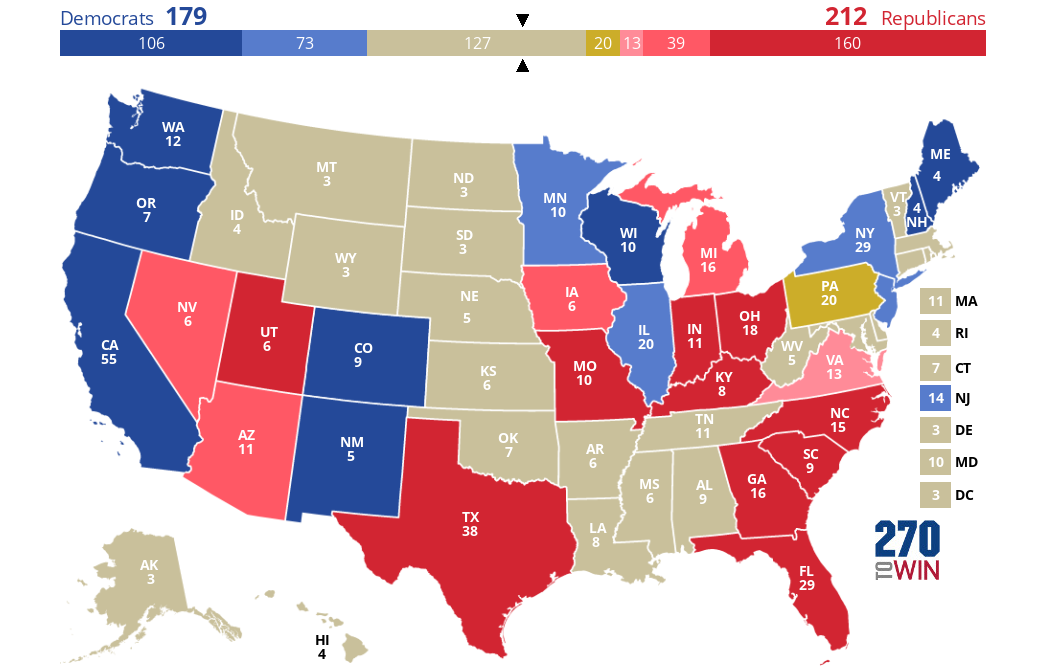
Finally, if only white people with college degrees could vote, Trump would get 212 EVs (12 less) to Clinton's 179 (8 less). Note that Pennsylvania is marked "other"; this is because the white college graduate vote was split exactly evenly (48-48) in that state.
In conclusion, ranking demographic groups from most to least Republican gives this result:
- White men
- White people overall
- Men overall
- White women
- People 45/older
- The American electorate overall
- White college graduates
- People under the age of 45
- Women overall
Subscribe to:
Posts (Atom)