Wednesday, January 30, 2019

How do behavior geneticists respond to epigenetics?

Having read a very considerable amount of literature on human genetics, epigenetics, behavior genetics (BG), genetic determinism, etc. in the past six months or so I was often struck by the apparent failure of behavioral geneticists to adequately address conceptual criticisms of their methodologies in general. One specific criticism that they appeared not to have devoted much effort to addressing nearly adequately was that the idea of relative, separable contributions of genes versus environment to (variation in) complex behavioral traits is no longer scientifically tenable. One line of evidence, on which I will focus here, often cited to support this claim is that of the field of epigenetics. Why is this a problem for BG (if the critics are to be believed, anyway)? I will try to break this question down before getting into responses to objections:

The first answer to the above question is that BG is fundamentally focused on DNA as though it was the only way that human traits could be biologically transmitted across generations. But Charney (2012a) has noted:


"DNA can no longer be considered the sole agent of inheritance...The epigenome, that is, the complex biochemical system that regulates DNA expression, turning genes on and off and modulating their “transcribability,” has been found to be heritable, both somatically and intergenerationally via the germline, enabling the biological inheritance of traits with no changes to the DNA sequence. Furthermore, the epigenome is highly environmentally responsive. Environmentally induced changes in gene transcribability can have long-term – sometimes lifelong – phenotypic consequences."

So what does this all mean? It means that you can't just focus on the DNA, you must also focus on epigenetic processes as means of transmitting biological "information" through generations. Right? And it also looks like epigenetic processes can both alter DNA expression and be changed by environmental factors. This latter phenomenon, if it is true, means changes in the environment could indirectly led to changes in expression of DNA, meaning that the environment can affect genes. Surely this means that it is meaningless to refer to "genes" vs. "environment" as separate when this relationship demonstrates that they are anything but, with changes in the latter capable of changing expression of the former?

Maybe not: one common tactic of BG researchers when confronted with the supposed existence of transgenerational epigenetic inheritance is to say "nuh-uh!". More precisely they tend to argue that the evidence for epigenetic inheritance allowing traits to be inherited without DNA sequence changes is weak or nonexistent. For example, Barnes et al. (2014) claim, 


"...epigeneticists are urging social scientists to be more cautious when discussing epigenetic influences on social behavior. In the words of two preeminent epigeneticists, Heijmans and Mill (2012: 4): “[E]pigenetics will not be able to deliver the miracles it is sometimes claimed it will.” Perhaps unknown to sociologists who have hung their future of the field on epigenetics, epigeneticists are confronted with the same problems genomic and biosocial scientists are encountering." 

Similarly, Battaglia (2012) noted, "the relationship between widespread epigenetic marks and genetic expression is still controversial." This particular paper was also cited by Liu & Neiderhiser (2017, p. 100), who also make a very similar point in saying (p. 101), "findings from epigenetic studies are still controversial and inconsistent, especially in humans".

Let's return to Liu & Neiderhiser (2017), a book chapter that goes into more detail than anything else I've seen in "debunking" conceptual criticisms of BG. This same chapter states (pp. 100-101): "...proponents of an epigenetic approach would expect that the environ mental and behavioral inputs over time would contribute to increasing variation in gene expression, thus decreasing the phenotypic concordance among MZ and DZ twin pairs. However, this prediction is not consistent with the finding that for intelligence, the degree of similarity among MZ twin pairs increases throughout the life span and the heritability of intelligence continues to increase linearly with age". This argument is also made by Battaglia (2012). Charney (2012b) responds to Battaglia by saying the following: 


"Both Battaglia and MacDonald & LaFreniere argue against the claim that MZ twins become more epigenetically and genetically discordant over their lifetimes by citing studies that purport to show that heritability increases with age. I am not sure if their claim is that these studies demonstrate that epigenetic discordances of MZ twins do not, in fact, increase over time, or that, although they may increase over time, they have no effect upon phenotypes. If the former, then clearly the results of a twin study cannot refute the existence of increasing epigenetic discordance, a phenomenon that has been repeatedly demonstrated by advanced molecular techniques (Ballestar 2009; Fraga et al. 2005; Kaminsky et al. 2009; Kato et al. 2005; Martin 2005; Mill et al. 2006; Ollikainen et al. 2010; Petronis et al. 2003; Poulsen et al. 2007; Rosa et al. 2008). To deny this would require a refutation of these studies. So, I take the argument to be the latter, namely, that studies that purport to show that heritability increases with age demonstrate that whatever epigenetic (and genetic) changes MZ twins experience over their lifetimes have no effect upon, for example, cognitive development.
Such generalizing from one or two studies concerning one or two phenotypes to all behavioral phenotypes is a common practice in the twin study literature, and it is also an example of the fallacy of “hasty generalization.” Given that the results of a number of other twin studies draw the opposite conclusion–that heritability decreases with age–including the heritability of cognitive ability, such an argument in this context is perhaps more accurately characterized as an instance of the fallacy of neglect of relevant evidence. For example, according to Reynolds et al. (2005):
As the number of waves of data collection in longitudinal twin studies has increased, behavior genetic analyses of changes with age have begun to be conducted. Results suggest strong genetic influences on stability (Plomin et al. 1994) over the short term. Initial cohort-sequential analysis suggested a decline in heritability of IQ from age 60 to age 80 (Finkel et al. 1998), a conclusion that has been supported by cross-sectional results from other twin studies of aging (McClearn et al. 1997; McGue & Christensen 2002). (Reynolds et al. 2005, p. 3)
And as Reynolds et al. (2005, p. 13) note of their own study: “The findings of the present study can be construed as generally supportive of theories proposing the increasing importance of the environment with respect to cognitive aging: Although heritable influences are of greater relative importance for individual differences in cognitive performance, environmental variances increase steadily after age 65.” Other twin studies have reported decreasing heritability for personality (Floderus-Myrhed et al. 1980; Pedersen et al. 1988), science scores (Haworth et al. 2009), extraversion and introversion (Viken et al. 1994), self-esteem (Jonassaint 2010; Raevuori et al. 2007), body mass index (Korkeila et al. 1991), and anxiety/depression (Saviouk et al. 2011)."

So Charney's (2012b) point here is clear: there is not very consistent evidence that heritability values in BG studies for all behavioral traits do, in fact, increase with age. On the contrary, the evidence for all behavioral traits taken together (rather than just intelligence, the only one BG defenders typically mention) is decidedly mixed and thus does not strongly contradict or support the "epigenetic approach" as Liu & Neiderhiser (2017) call it.

More criticisms of the argument that epigenetics has significant effects that are relevant to BG are made by Moffitt & Beckley (2015). First, they claim, "...methylation is ubiquitous and normative, and usually it has nothing to do with experience but is part of organism development that is, incidentally, under genetic control. Because the genome is identical in each of our cells, during normal development, most of our genes must be methylated, lest a kidney cell grow into an eye or a fingernail cell grow into an ear. Against this normative background, methylation marks that can be statistically associated with external experience are relatively rare, and effect sizes are expected to be small." They also have six more criticisms of epigenetics-centered human behavioral research, but criticisms 2-4 inclusive are all technical and centered around whether such research is feasible, not whether there is strong evidence for the reality of epigenetic effects on DNA expression and thus on behavior. 


Before moving onto Moffitt & Beckley's last 2 objections, I will note something about the first sentence in the quote I cited in the above paragraph. They claim that methylation is part of the development of the organism, and that (this is crucial) this development is "under genetic control". Really? In any case, DNA methylation is only one kind of epigenetic process: there are also other processes like histone acetylation, "histone methylation, phosphorylation, or ubiquitination, to name a few" (Moore 2017). Thus, it is weird that Moffitt & Beckley devote 100% of their epigenetic-related attention in their article to DNA methylation. Moreover, they are claiming that environmental factors do not significantly affect DNA methylation and that this process does not significantly vary from a baseline level, but they do not cite any sources to support this claim. 

What is objection 5? Here's an excerpt: "...although a small set of nonhuman studies provide initial evidence that experience can apparently alter methylation, it is far from clear that the detected methylation alterations have any consequences for health or behavior. Before methylation can affect health or behavior, it must alter expression of genes. Links from methylation data forward to gene expression data are not yet known." This is also an argument from Battaglia (2012). Charney (2012b) responded to Battaglia's argument that there is not very much evidence that epigenetics affects human behavior by saying, 


According to Battaglia, though epigenetic effects are potentially important, the individual and specific impact on brain and behavior is neither well understood nor unambiguously linked to gene expression data. In support of this assertion, he mentions a study by Zhou et al. (2011). Whatever Battaglia's precise intent in mentioning this study, their conclusion unambiguously links epigenetic changes to changes in gene expression and behavior:
In addition to histone modifications, gene expression is also regulated by many components of the complex transcriptional machinery and also involves other mechanisms such as DNA methylation. Nonetheless, our results reveal genome-wide alteration of histone H3K4 trimethylation resulting from long-term cocaine and alcohol exposure, and accompanying large-scale changes in gene expression that implicate several functional pathways in substance-shared and substance-specific fashion. (Zhou et al. 2011, p. 6631)
But it is important to remember that, as Lester et al. (2016) have pointed out, "the use of epigenetics to study human behavior is just beginning". In other words, there is no question that there is still a lot we don't know in regards to human behavioral epigenetics. Does this mean we should assume it is totally irrelevant to the study of human behavior? This question may seem stupid--"Of course we shouldn't!"--but in fact it is pretty important here. The critics of BG contend that epigenetics demonstrates that the environment can affect what genes do (i.e. how they are expressed) regarding behavior. But the researchers who want to treat genes and environment as separate (though this practice is scientifically indefensible) can just say there's not enough evidence that these effects exist, or even if there is, there's not enough evidence they actually significantly affect human behavior, or even if there is, we can use mathematical simulations that bear no relationship to what is actually happening in the real world to "show" that this only results in a slight change in heritability estimates from classical twin studies (Liu et al. 2018). We see that BG defenders thus have several stages of "fall-back" arguments when confronted with evidence about the inseparability of genes vs. environment.


There are also some baseless arguments-by-assertion merely claiming, with no supporting evidence, that epigenetic processes and their ability to mediate environmental effects on gene expression do not pose a fatal problem for BG studies. Here's an example from a response of some BG researchers to critiques (McGue et al. 2005): "Although the study of epigenetic phenomena may provide a powerful paradigm for developmental psychology, it will not obviate the need for twin, adoption, and family research like that reflected in our article (McGue et al., 2005)." This strange and totally unsupported argument has made its way elsewhere: Liu & Neiderhiser (2017, p. 100) cite McGue et al. (2005) and make the same exact claim with no additional support. 


Other fallacies that rear their heads in the responses-to-epigenetics literature include the good-old-fashioned straw man. For example, you could construct a straw man version of epigenetics and developmental systems theory, and the associated schools of thought, according to which proponents of these ideas believe that DNA is totally irrelevant to human behavior. Of course, like any good straw man, this is a totally inaccurate representation of these people's views, but that doesn't stop Liu & Neiderhiser (2017, p. 100) from informing us that "DNA sequence variations are important and will continue to be important." Duh! Who are these imaginary epigenetics proponents claiming that DNA should be ignored entirely? They don't exist! If you wanna know what these individuals actually believe, maybe read some of their work, such as a recent paper by Overton & Lerner (2017, p. 117): 


  • "the burgeoning and convincing literature of epigenetics means that genetic function is a relatively plastic outcome of mutually influential relations among genes and the multiple levels of the context within which they are embedded (cellular and extracellular physiological processes, psychological functioning, and the physical, social, and cultural features of the changing ecology [e.g., Cole, 2014; Slavich & Cole, 2013])."


But BG researchers always have one more consistent "out" when confronted with epigenetics: claim that it can be incorporated into BG research. This is one of the most common answers to the question that forms the title of this post. Liu & Neiderhiser (2017), for instance, after casting doubt on the importance and DNA-independence of human epigenetics for almost two full paragraphs, tell us (p. 101), "In sum, we wish to emphasize that family-based behavioral genetic approaches are a promising way to study complex epigenetic effects and gene expression." This message seems oddly inconsistent with what they said in the previous dozen sentences or so, but OK. Moffitt & Beckley make a similar but distinct suggestion: that twin studies be used not to estimate heritability (their most common purpose historically), but to rule out potential confounding factors and biases: 

"Dizygotic twins are ideal for testing what factors explain behavioral differences between siblings who are matched for age, sex, ethnic background, and most early rearing experiences. Discordant monozygotic twins are ideal for studying environmentally induced variation in the behavior of siblings matched even further, for genotype (Moffitt, 2005a)...The current recommendation from the experts is, if you plan to study human epigenetics, then at least use twins." (Moffitt & Beckley 2015)
I admit, that last sentence made me chuckle (it's clearly a reference to the common cliche about at least using a condom if you plan to have sex). Note that in making this recommendation, Moffitt & Beckley do not argue that classical twin studies or heritability estimation are scientifically valid or worthwhile; instead they try to argue that twin studies should be used for a totally different purpose.

Sunday, January 27, 2019

More on the 2016 election

This is an extension of another recent post on this blog in which I outlined several hypothetical Electoral College maps. First, I want to depict what the results of the 2016 Democratic primaries would have been if delegates were awarded winner-take-all, like electoral votes are in general presidential elections. Of course, this also assumes that each state has the exact same number of delegates as it does electoral votes (which is definitely not true); it also ignores primaries in non-state territories like Puerto Rico which can vote in primaries but not in general presidential elections, and the fact that ME and NE have different electoral college systems, but whatever: let's get into it.

So the map below shows the results of the primaries: Clinton won yellow states on this map while Sanders won green states. Darker yellow =  greater % margin of victory for Clinton and darker green = greater % margin of victory for Sanders.


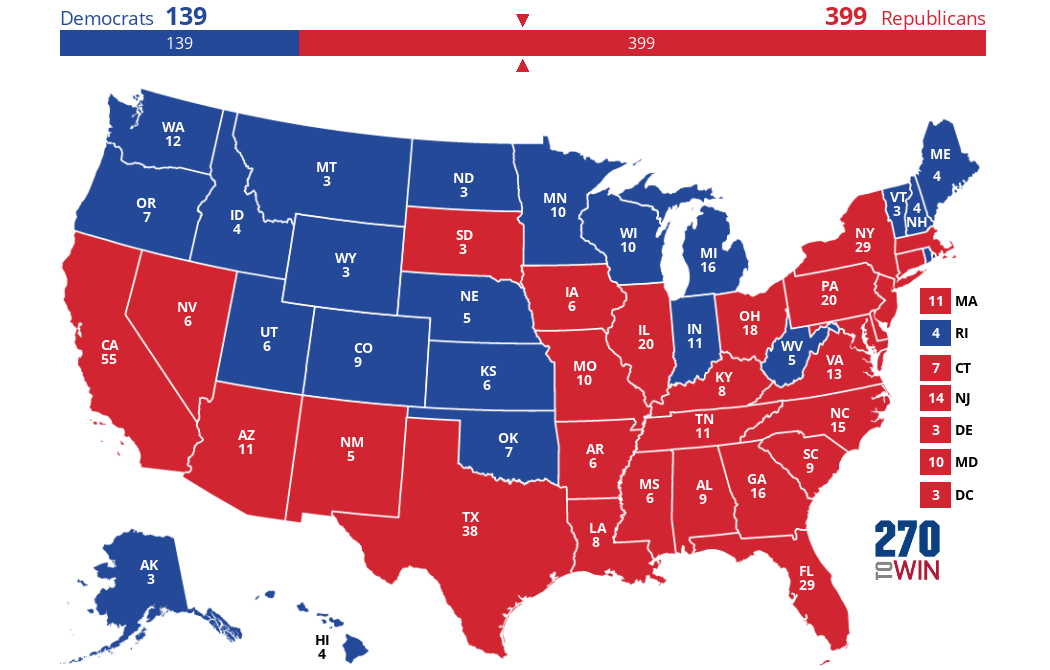
First, let's convert this into an electoral map regardless of margin of victory, with Clinton as red and Sanders as blue:
So we see here a very comfortable victory for Clinton, who wins 399 electoral votes to Sanders' 139. This gives Clinton about 74% of the electoral votes (EVs) to only 26% for Sanders. This, of course, is not very fair because Clinton only actually got about 55% of the vote in all primaries/caucuses combined, compared to about 43% for Sanders. Part of this disproportionality is because the above map, being winner-take-all, masks the fact that some primaries were much closer than others. This can be seen in my second map, made based on data from the source linked above. States where either candidate won with <50% of the vote are gray on the map below. The three color levels are 50-60%, 60-70%, and 70+%.


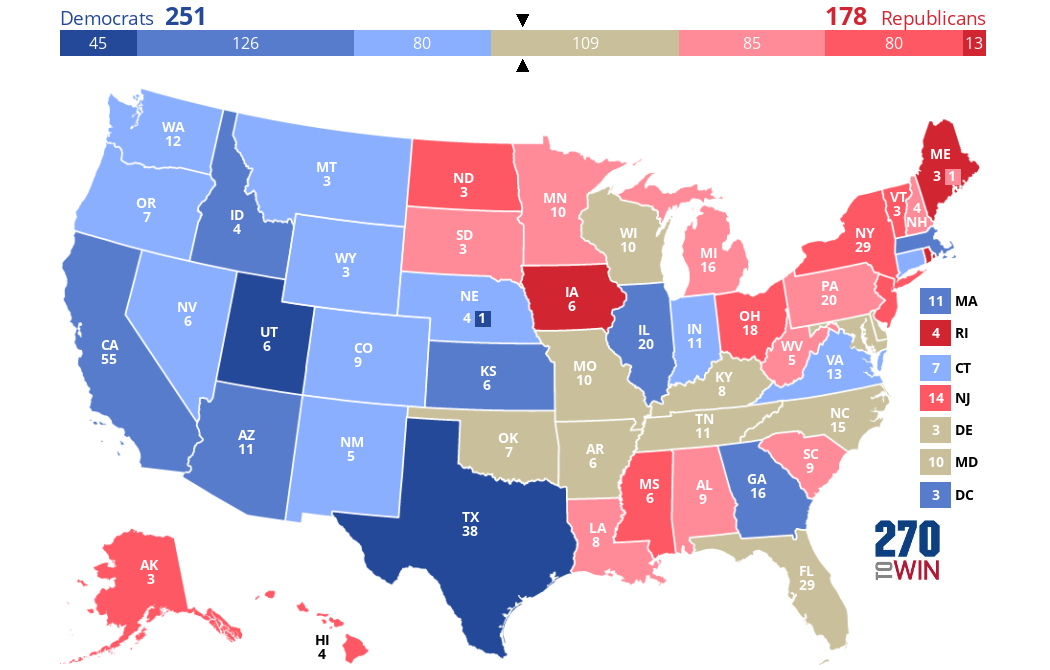
I also wanted to show some maps with different metrics, both related to the general election. The idea is as follows: take the shift from 2008 to 2012, then use that to predict the results of the 2016 election (I already did this in my previous post). Then, take the difference between this prediction and the actual 2016 election results, and create a map of this difference (blue = Clinton did better than this prediction and vice versa). In this map, if the difference is <1% either way, the state will be gray. So here it is:
This map looks quite different from any other map I've looked at regarding the 2016 election. So what we see is that Clinton did much better than expected (based on trends from 2008 to 2012) in Texas and Utah, while Trump did much better than expected in Iowa, Maine, and Rhode Island of all places! This despite the fact that Trump did win IA, but he lost both ME and RI. We also see that most states (29 out of 51 or 57%, including DC as a state and not counting individual congressional districts) were less than 5 points off in either direction from what would be predicted here. Furthermore, we see that Clinton did remarkably well almost everywhere in the west, with the notable exceptions of both Dakotas and Oklahoma. In fact, she did at least 1% better than expected even in some of the most Republican states in the US out west, including Wyoming, Montana, and Idaho (Idaho voted about the same in 2016 as it did in 2012).

Lastly, Clinton's performance in Wisconsin is also very much in line with what would be expected, and even in MI and PA, she did only slightly worse than one would expect. Trump also did only slightly better in WV than you'd expect, indicating that his landslide victory there was actually not very unusual. OH and IA are different stories, however, as Trump did much better in both (especially IA) than you would expect. And most of the medium/dark blue states here also voted more D overall from 2012 to 2016 (CA, AZ, TX, my own state of GA, KS, MA, etc.) It's also notable that NY and VT, among other New England states, voted a lot less Democratic than you'd expect in 2016.

I also wanted to show another map I made based on the 2012-2016 shift in presidential election results for each state. Each value is the average of the shifts from Dave Leip's Atlas and a Google Doc spreadsheet (with the exception of congressional district results, which I calculated myself).


Thursday, January 24, 2019

Gould, Richardson et al. v. Spearman (2018)

Judge: Order, order in the court, settle down, everyone! Today, November 3, 2018, I wish to formally begin deliberations in the case of Stephen Jay Gould, Ken Richardson, et al. v. Charles Spearman.  Spearman, the defendant, has been charged with one count of reification, one count of conflating correlation and causation, and one count of attempting the pointless task of accurately reducing a complex entity - namely, human intelligence - to a single number. The plaintiffs include Gould, Richardson, Henry Schlinger, and a number of others  from whom we shall soon be hearing. The plaintiffs will now be allowed to call their first witness to the stand. Mr. Lawyername, who do the plaintiffs want to present as their first expert witness?

John Lawyername, the lawyer for the plaintiffs: Your honor, we wish to present Henry Schlinger, professor at California State University, Los Angeles, as our first witness today.

Judge: Very well. Mr. Schlinger, please take the stand.

Schlinger: Thank you for allowing me to testify today. Ladies and gentlemen of the jury, I believe that Spearman "took an abstract mathematical correlation and reified it as the general intelligence that someone possesses" (Schlinger 2003, p. 17). In addition, "Spearman saw what he wanted to see in his data...Once the error of reification is committed, it is easy to commit another logical error, circular reasoning...In Spearman's case, the only evidence for g, or general intelligence, were the positive correlations, even though it was those positive correlations he was trying to explain in the first place" (ibid.). Lastly, Spearman portrays the results of factor analyses of IQ test scores as synonymous with intelligence, even though "The positive intercorrelations that result from factor analysis of their test scores are themselves far removed from the behavior of any individual in the test-taking situation or, for that matter, in any other context" (ibid.).

Judge: Mr. Spearman, who do you wish to call as your first expert witness?

Spearman: Next, I would like to call Charlie Reeve and Milton Hakel to the stand.
Reeve & Hakel: "All constructs are abstractions, purposely invoked to describe coherent classes of phenomena that co-occur in nature. For instance, gravity is a mathematical construct that describes one of the four classes of forces associated with matter. Similarly, g is a psychometric and psychological construct that describes a class of phenomena associated with results of human mental functioning. Both of these constructs are abstract ideas; both are latent. However, because the phenomena ascribed to these constructs can be observed, the constructs are subject to conceptual refinement, measurement, and verification" (Reeve & Hakel 2002, pp. 48-49).

The plaintiffs wish to call Stephen Jay Gould to the stand.
Gould: "The misuse of mental tests is not inherent in the idea of testing itself. It arises primarily from two fallacies, eagerly (so it seems) endorsed by those who wish to use tests for the maintenance of social ranks and distinctions: reification and hereditarianism" (Gould 1981, p. 155; cited in Carroll 1995). Also, "many factorists have...tried to define factors as causal entities. This error of reification has plagued the technique since its inception. It was "present at the creation" since Spearman invented factor analysis to study the correlation matrix of mental tests and then reified his principal component as g or innate, general intelligence" (Gould 1996, p. 284).

Judge: Who do you want to call  to respond to these accusations that you are guilty of reification?

Spearman: Your honor, I wish to call John Carroll as my first witness.

Carroll: Gould's criticisms of Spearman, and of research on IQ tests as a whole, are mistaken. This is because, contrary to Gould's assertions, "...factor analysis implies no "deep conceptual error" of "reification."...Merely because it is convenient to refer to a factor (like g) by use of a noun does not make it a physical thing. At the most, factors should be regarded as sources of variance, dimensions, intervening variables, or "latent traits" that are useful in explaining manifest phenomena, much as abstractions such as gravity, mass, distance, and force are useful in describing physical events. Gould's far-reaching condemnation of factor analysis as a device for producing reifications is one of his own deepest conceptual errors; it stands factor analysis on its head" (Carroll 1995).

And Jensen & Weng as my second witness.
"...Gould’s strawman [sic] issue of the reification of g was dealt with satisfactorily by the pioneers of factor analysis, including Spearman (1927) Burt (1940) and Thurstone (1947)...the consensus of experts is that g need not be a “thing”-a “single, ” “hard,” “object’‘-for it to be considered a reality in the scientific sense. The g factor is a construct. Its status as such is comparable to other constructs in science: mass, force, gravitation, potential energy, magnetic field, Mendelian genes, and evolution, to name a few. But none of these constructs is a "thing"" (Jensen & Weng 1994, p. 232).

The plaintiffs call Joseph L. Graves and Amanda Johnson to the stand.

Graves & Johnson: Spearman has clearly confused correlation with causation in positing the existence of a g factor based on positive correlations between IQ test scores. The fact is, "...such variables may be statistically correlated without necessarily having any functional relationship... Science recognizes this fact and demands the implementation of experimental techniques to establish causal relationships. Pseudoscience, on the other hand, is content with the bald assertion that, given a correlation, a causal relationship must exist" (Graves & Johnson 1995, p. 281).

Next we will deliberate the charge that the g factor identified by Spearman is inconsistent and unstable. 

The plaintiffs once again call Joseph L. Graves and Amanda Johnson to the stand.

Graves & Johnson: "...g can vary widely, depending on how it is calculated. Such admissions explain why batteries of tests applied to individuals and groups return different values of correlation; certainly, one would not expect a fundamental underlying mechanism to behave so capriciously. Similarly, a physicist would not expect to get different values for the speed of light depending on the technique used to measure it. Thus, the mutability of g significantly hinders the scientific legitimacy of psychometric theory" (Graves & Johnson 1995, p. 281).

The defendants call Johnson, te Nijenhuis, and Bouchard to the stand.
Johnson, te Nijenhuis, & Bouchard: "...the g factors identified by the batteries were completely correlated (correlations were .99, .99, and 1.00). This provides further evidence for the existence of a higher-level g factor and suggests that its measurement is not dependent on the use of specific mental ability tasks...Our analyses indicate that g factors from three independently developed batteries of mental ability tests are virtually interchangeable" (Johnson et al. 2004, p. 104) In a subsequent replication of this study, it was again found that "...the g factors were effectively interchangeable" (Johnson, te Nijenhuis, & Bouchard 2008, p. 89)

I also wish to  call Jensen & Weng to the stand again.
Jensen & Weng: "...g is remarkably robust and almost invariant across different methods of analysis, both in agreement between the estimated and the true g in simulated data and in similarity among the g factors extracted from empirical data by different methods" (Jensen & Weng 1994, p. 231).

Judge: So, Dr. Spearman, what is the main point that your witnesses wish to make regarding the plaintiffs' claims that your g factor is so inconsistent as to be scientifically invalid?

Spearman: The main point, your honor, is that these accusations, such as those by Graves & Johnson, are simply false. On the contrary, the evidence that has just been presented shows that the g factor is highly consistent no matter what method is used to calculate it.

Judge: This is a difficult case. It seems like the assumption that correlations between test scores prove the existence of a single dimension of intelligence is unwarranted, but referring to the existence of this correlation, which is not controversial, is not necessarily problematic. What is problematic is when researchers talk out of one side of their mouths and say "We never thought factors were actual things! We refer to them as constructs! The g factor is a construct, not a thing!" while, at other times and other places, talking about individual and group differences in g, the heritability of g, whether it is possible to boost g with Head Start programs, etc. None of these latter descriptions would make sense if these scholars did not believe that g were an actual human quality, rather than an abstract theoretical construct. Clearly, g theorists do treat the g factor as "a real property in the head" (Gould 1994), despite their frequent insistence.

References
Carroll. Reflections on Stephen Jay Gould's The Mismeasure of Man (1981). Intelligence. 1995.
Gould. The Mismeasure of Man (1st edition). 1981.
Gould 1994
Gould. The Mismeasure of Man (2nd edition). 1996.
Graves & Johnson 1995.
Jensen & Weng 1994.
Johnson et al. 2004.
Johnson, te Nijenhuis & Bouchard 2008.
Reeve & Hakel 2002.

Saturday, January 19, 2019

Emil Kirkegaard blogged about me?

It's true! Wow, this is a weird feeling to be in the spotlight like this, even if only to a relatively small extent (which this clearly is). Anyway, some background is in order: I submitted a paper to one of Kirkegaard's journals last year despite not agreeing with him on many controversial issues only to later decide to withdraw it while it was still being "reviewed" on one of their open "peer-review" forums (by reviewers who often have little/no relevant expertise). Anyway, this is about a post I recently made on reddit from a subreddit from which I have since been banned (namely, /r/heredity).

Basically I was reiterating arguments I considered to be compelling that I came across in Misbehaving Science, a 2014 book by Aaron Panofsky. I bought this book online through Amazon and finished reading it last summer. The arguments I was outlining were that behavior genetics  (BG) researchers, when responding to their critics, tend to focus on relatively narrow statistical and empirical issues, rather than more fundamental, and thus important, underlying theoretical/conceptual problems. In doing so I was also trying to draw attention to arguments made by one prominent critic of the common genetic-deterministic interpretation of heritability coefficients, Peter Taylor, in this paper. I had noticed that others on this subreddit had been citing the work of Neven Sesardic to defend heritability and the way the concept is often used in the BG field. With this background established, I will quote from Kirkegaard's post:

"There’s a certain type of person that doesn’t produce any empirical contribution to “Reducing the heredity-environment uncertainty”. Instead, they contribute various theoretical arguments which they take to undermine the empirical data others give. Usually, these people have a background in philosophy or some other theoretical field. A recent example of this pattern is seen on Reddit, where Jinkinson Payne Smith (u/EverymorningWP) made this thread:

And then he quotes from the post I made that I was describing above. Honestly almost as surprising as him blogging about me is the fact that he knows my middle name. I must have posted it somewhere--I know it's on this blog, I guess some other places (Wikipedia, I think).

Here is what he says after quoting my post: "So: It works in practice, but does it work in (my) theory? These philosophy arguments are useless. Any physics professor knows this well because they get a lot of emails allegedly refuting relativity and quantum mechanics using thought experiments and logical arguments (like Time Cube). These arguments convince no one, even if one can’t find the error in the argument immediately (like in the ontological argument). It works the same way for these anti-behavioral genetics theoretical arguments. If these want to be taken seriously, they should produce 1) contrasting models, 2) that produce empirically testable predictions, and 3) show that these fit with their model and do not fit with the current behavioral/quantitative genetics models.

And then he calls me out by name! Specifically, he does so in the last paragraph of his post, which I have copied and pasted verbatim below:

"I must say that I do feel some sympathy with Jinkinson’s approach. I am myself somewhat of a verbal tilt person who used to study philosophy (for bachelor degree), and who used to engage in some of these ‘my a priori argument beats your data’ type arguments. I eventually wised up, I probably owe some of this to my years of drinking together with the good physicists at Aarhus University, who do not care so much for such empirically void arguments."

For a while I have been looking at many of the BG researchers focusing on genetics, race, IQ, etc. and I have suspected that they seem to really get off on using the word "empirical". This perception has only been bolstered by not only Kirkegaard himself, but also by many other people with whom I have been arguing about these topics on Reddit, as well as other articles I have read in the peer-reviewed BG literature.

One more thing: the point Kirkegaard made in the immediately above paragraph is reminiscent of a point someone else made on the same Reddit post that started all this. I don't remember who, but someone (maybe Kirkegaard himself) did mention physics and arguing that people can come up with silly theoretical concepts/thought experiments that seem to refute well-established theories in physics, but which collapse upon empirical scrutiny. Not knowing much of anything about physics, I am not going to dispute this point except to say that theoretical concerns are not necessarily invalid, nor are they necessarily trumped or refuted by statistics. Furthermore, it should be borne in mind that statistics or empirical evidence is not necessarily meaningful; it must be interpreted in a way that accurately reflects the underlying processes at work in what is being studied.

Thursday, January 10, 2019

Some hypothetical electoral maps

What would have happened in 2016 if every state had shifted from the 2012 election by the same amount it shifted from the 2008 election in 2012? 

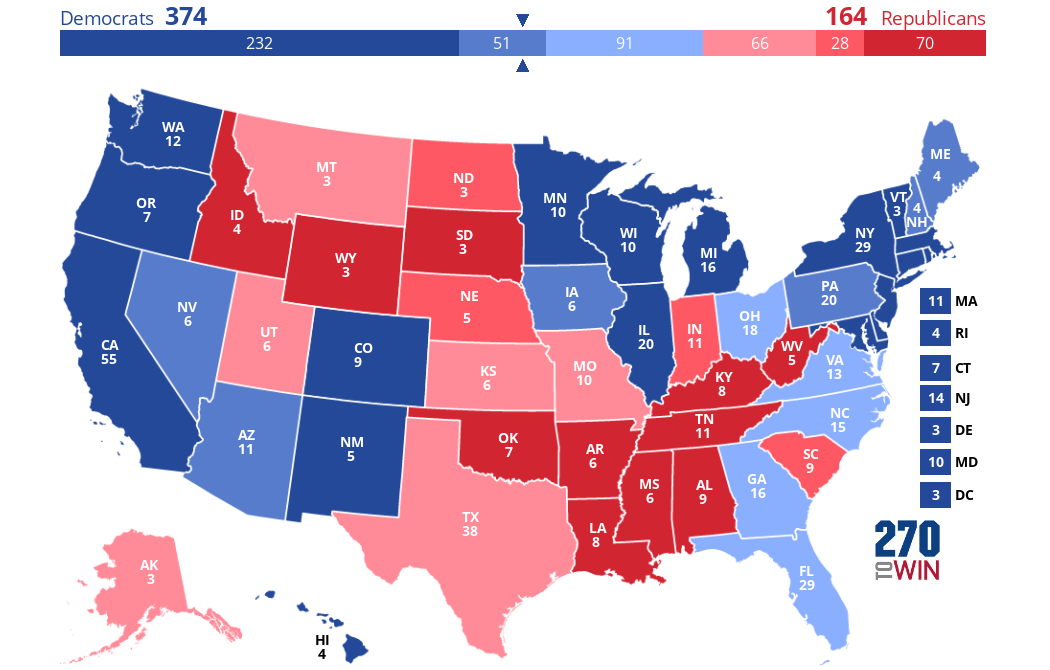
First, as a reference, let's look at the actual results of the 2012 election (taken from Wikipedia and made on 270towin.com):

In this map ("map #1"), all states that were won by the Democrat/Republican by <5 points are in light blue and light red, respectively. All states won by between 5 and 10 points are medium dark blue (e.g. Pennsylvania) or medium dark red/pink (e.g. Arizona). Finally, all states won by >10 points either way are solid blue/red. 

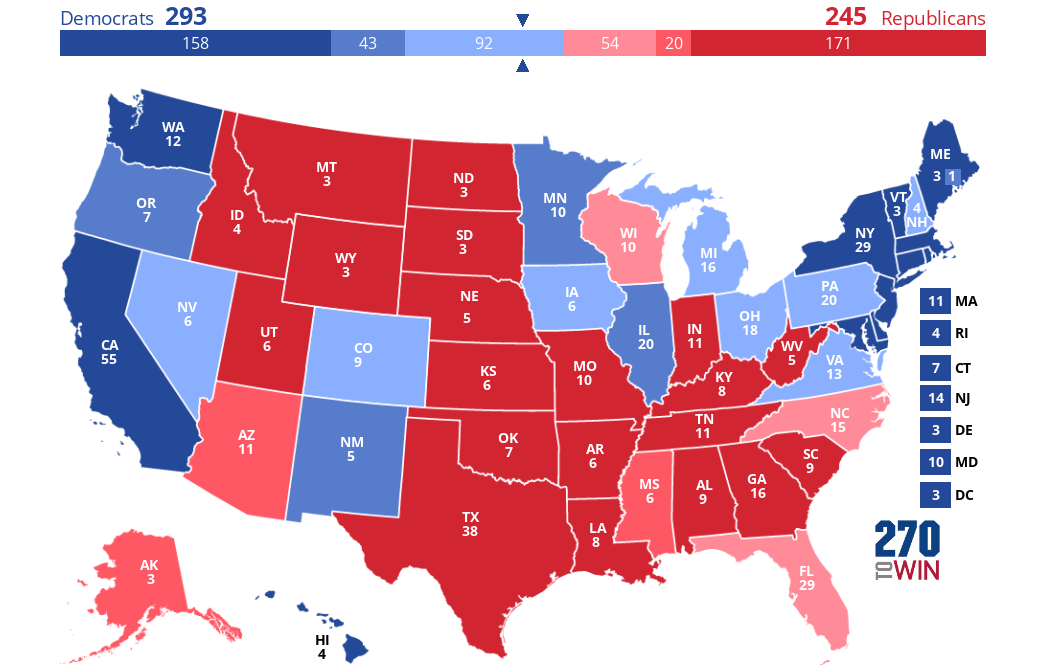
Anyway, what's the answer to the question in the first sentence of this post? What would the outcome of the 2016 election have been? To answer this question, I used data from Dave Leip's extremely useful Atlas of Presidential Elections and created this map (or "map #2"), also on 270towin.com (note that all subsequent maps are colored the same way as the first one):


So the answer, in short, is the Democrat wins the Electoral College 293-245. This would have represented the Democrat getting 57 more (and the Republican getting 57 fewer) electoral votes than their party's candidate actually did in 2016. Note that, although this is not shown in the map above, there are 3 states expected to have margins of <1% here (and which could thus be marked as tossups): WI, NV, and PA. 

Perhaps the most notable thing about this map is that, with respect to the party that wins each state, it is identical to the 2012 electoral map with only two exceptions: Florida and Wisconsin have both flipped from D to R. 

What else changes in this predicted map compared to the 2012 results? NV, CO, IA,  MI, PA, and NH all turn a shade lighter blue, while MO, GA, and the 2nd congressional district of NE all turn a shade darker red. Mississippi and Alaska both turn a shade lighter red because Obama did better there in 2012 than in 2008, to the extent that both states are expected to be won by the R candidate by between 5% and 10% in 2016.

Here are the states where the margin in 2016 is predicted to be <5% either way. States predicted to flip will be underlined from here on out.
Michigan
2.5%
Iowa 2.1%
Colorado 1.8%
New Hampshire 1.6%
Virginia 1.5%
Ohio 1.4%
Nevada 0.9%
Pennsylvania 0.5%
Wisconsin -0.1%
Florida -1.0%
North Carolina
-4.4%

Notably, in addition to mostly being similar to what happened in 2012, map #2 also comports pretty well with what actually happened in the 2016 election (i.e. Trump won both Florida and Wisconsin), except that he also won four additional pale blue states on this map (IA, MI, OH, and PA). He also won the medium-dark-blue 2nd congressional district of Maine by over 8%, though here it is predicted to go D by almost 6%, and Obama won it in 2012 by almost 10%! We also see that of these eleven states, Clinton won only four of them (CO, NH, VA, and NV).

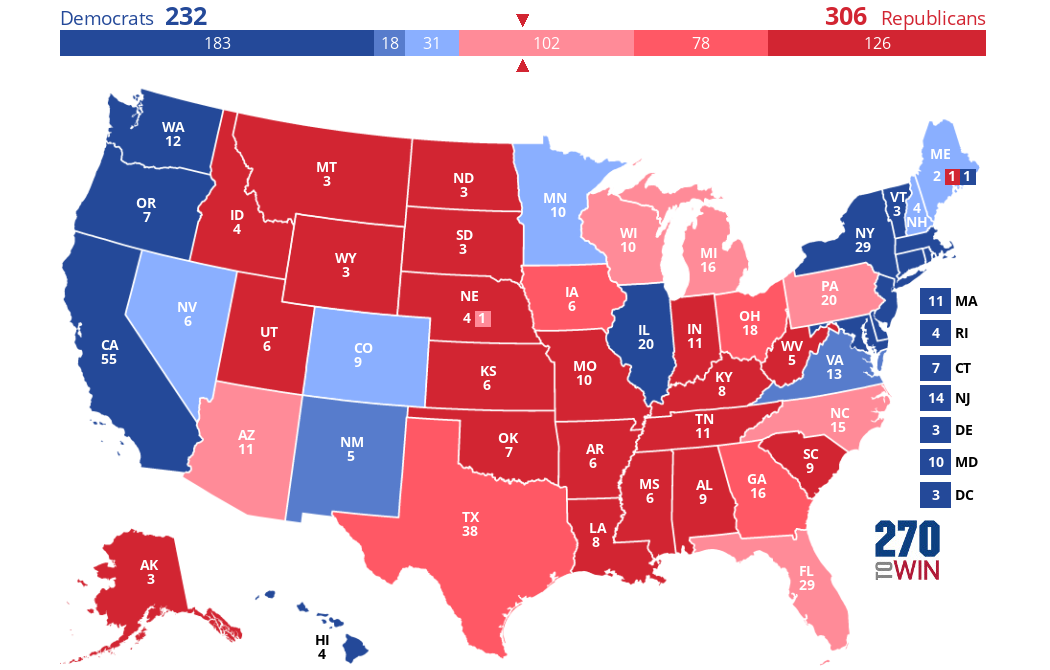
For comparison, I have illustrated the results of the 2016 election in the map below (map #3).


The fact that Trump won every state predicted to be won by the Republican in map #2, as well as 4 states (and 1 congressional district) predicted to go Democratic, further indicates that he did better (at least relative to Clinton) than one would normally expect, even accounting for the generally pro-R shift the country was already undergoing. 

In addition to the party differences noted above, here are also some shading differences between map #2 and the actual 2016 election (i.e. states that were predicted to be won by the correct party, but by a margin in the wrong color range) are as follows: 


  • MS and AK are medium-red on map #2, but both states were dark-red in 2016 (Trump won then both by >10 points). 
  • TX and GA are both dark-red on map #2, but both states were medium-red in 2016 (Trump won them both by between 5 and 10 points).
  • VA is light blue on map #2, but because Hillary won it by between 5 and 10 points, it was medium-blue in 2016.
  • ME is dark blue on map #2, but it should be light blue because Hillary won it by <5 points.
  • MN and OR are both medium-blue on map #2, but MN should be light blue and OR should be dark blue (Hillary won MN by <5 points and OR by >10 points).
  • AZ should be light red, not medium red (as it is on map #2), because Trump won it by <5 points.
  • NE's 2nd congressional district is dark red on map #2, but it should be light red, because Trump won it by <5 points.
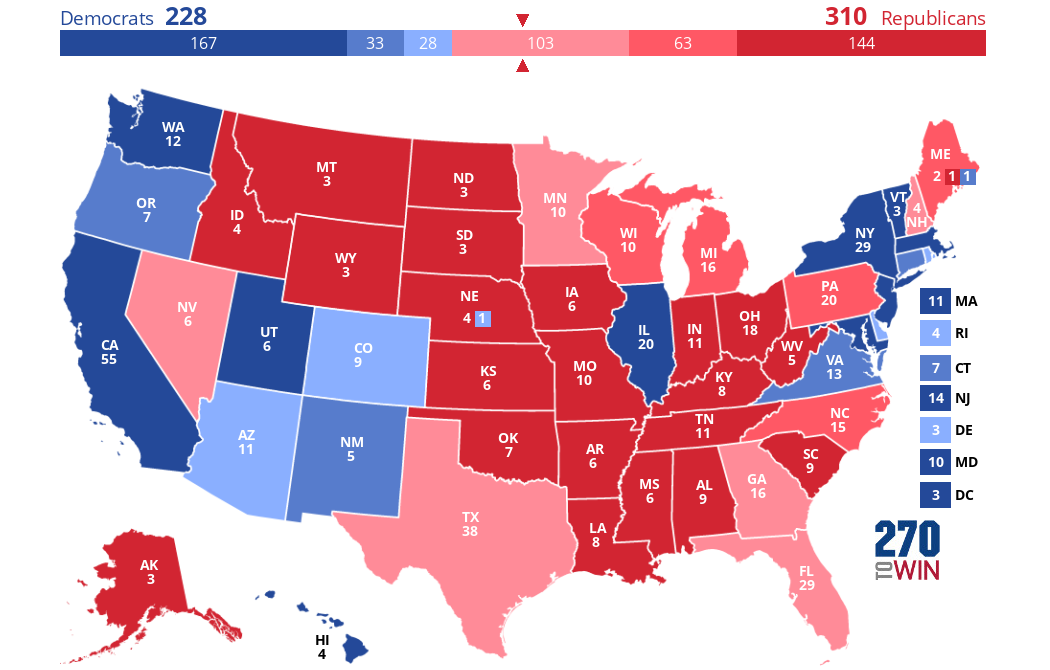
What about if the 2020 election was based on the shifts that happened from 2012 to 2016? Then this map (map #4) would be the result (same data sources and produced on the same website as above):
Weird fact: on the website the purple states were shown as having red and blue stripes. Adding the image through its URL here apparently changes the appearance of mixed electoral vote states for some reason. Anyway, here we see the Republican (presumably Trump) getting 310 electoral votes--four more than he got in 2016! This should not be a surprise because of course Trump did better than Romney in 2012, at least in most states; that's the reason he won when Romney didn't. In this map, four states are predicted to flip from D to R: Maine, Minnesota, Nevada, and New Hampshire. (Maine flipping means that Trump would win two of the state's electoral votes; he is also predicted to win its 2nd congressional district again, but to lose its 1st, which would give him 3 votes and the D candidate one vote from the state). Meanwhile, two states--AZ and UT--are predicted to flip from R to D, along with Nebraska's 2nd congressional district. 

Utah is a weird outlier on this map because it voted 30 points more Democratic in 2016 than in 2012. So if you take the result of the 2016 election in Utah (Trump wins by 18 points) and add 30 points in the D candidate's favor, this gives you a 12% D win, and since >10% margins here are shown in solid red/blue, Utah is solid blue on this map. But of course the odds of UT shifting 30% towards the Democrats again are pretty low, especially since Romney had no difficulty getting elected there last year. But then again, a recent poll suggests that a slight majority of Utah voters would not vote for Trump next November, so maybe it could happen: clearly voters there like Trump much less than normal establishment Republicans.

Some other weird facts about this map: 
  • Texas is expected to be really close: Trump is predicted to win it by only 2.2%, making it the second-closest state that he wins (behind only Nevada at 1.9%). 
  • Rhode Island is also predicted to be surprisingly close, with a D win predicted to be by only 3.6% (Trump shifted it way to the right in 2016). Delaware is a similar story (D expected margin of victory: 4.2%).
  • My own state, Georgia (along with Texas, also not typically considered a swing state), is expected to be closer than normal swing states like Florida and New Hampshire. This is caused by the fact that both GA and TX voted more Democratic in 2016 than in 2012--especially Texas, which swung almost 7% in the D's favor.
  • Ohio and Iowa, though long considered swing states, are both expected to be staunchly Republican in 2020--Iowa is predicted to be won by Trump by a larger margin than Mississippi, and Ohio is expected to be won by more than South Carolina!
The closest states (margins under 5%) are below (Trump wins red, D wins blue):

Colorado (4.4%)
Delaware (4.2%)
Rhode Island (3.6%)
Nebraska (2nd) (2.7%)
Arizona (2.0%)
Nevada (1.9%)
Texas (2.2%)
Georgia (2.5%)
Florida (3.3%)
Minnesota (4.7%)
New Hampshire (4.8%)

And finally, here is a map based on Trump's state-level net approval ratings (as of last month, according to Morning Consult). (Net approval rating = % who approve of Trump - % who disapprove.) Here, the coloring is the same as before, but I should note that if the approval rating was exactly + or -10%, it was placed in the "medium" color category (e.g. net rating of 10% = medium red, not dark red). This affected only two states: IA and NV (Trump's net approval rating was -10% in both states).
So, no surprise, Trump's approval ratings are net negative in every state he lost to Clinton in 2016. The (somewhat) surprising thing about this map is that they are also net-negative in nine states that he won in 2016: namely, AZ, FL, GA, NC, OH, PA, IA, WI, and MI. Of these, Trump's net approval rating is the lowest in MI and WI (both -12%!).