Friday, May 31, 2019
Moving to Medium
I will now only be posting on Medium from now on, rather than here, so click here if you want to read any of my future posts. My previous posts will still be available here though.
Tuesday, May 28, 2019
Relationship between poll quality and President Trump's (dis)approval rating
Background: President Trump often touts Rasmussen approval rating polls that give him relatively favorable ratings (e.g. [1], [2]). Critics have responded by arguing, among other things, that "Rasmussen's polling has consistently been higher than other polls in evaluating approval for Trump" [3]. This hypothesis was systematically evaluated in the current analysis, as was the hypothesis that higher-quality polls (as measured by FiveThirtyEight's rating system) tended to give the president higher/lower (dis)approval ratings, on average.
Methods: Trump presidential approval rating polling data was downloaded from this link (by clicking on the link labeled "presidential approval polls" at the bottom). Data were then analyzed to calculate average approval and disapproval ratings for polls with a) a specific letter grade from FiveThirtyEight, b) Rasmussen, and c) just all polls overall, to test for relationships of poll characteristics with the result.
Results: The average approval rating and disapproval rating across all polls was 42% and 54%, respectively. Letter grades for polls by agencies that had such grades assigned to them ranged from a minimum of D- to a maximum of A+. When grades were converted into a numerical score (D- = 1, then increasing by 1 more point for each letter-grade tier (D = 2, D+ = 3, C- = 4, etc.)), there was a strong negative correlation between letter grade and approval rating (r = -0.74), while the correlation between letter grade and disapproval rating proved to be very weakly positive (r = 0.06). There was also a fairly strong negative correlation between letter grade and net approval rating (the latter being % approval - % disapproval; r = -0.60). In addition, Rasmussen did indeed tend to produce higher average approval ratings for Trump than the average of all polls combined (47% vs. 42%), and it also produced lower average disapproval ratings (52% vs. 54%). Trump's average approval rating based only on the highest quality polls (A+ grade) is 41% and his disapproval rating based on such polls is 53%. Notably, this is also based on polls conducted during his entire presidency (so far); as such, it is unsurprising, but reassuring, that the average approval rating of 41% matches closely with the average of 40% estimated by Gallup.
Conclusions: I found strong evidence that higher quality polls tend to produce lower approval rating and net approval rating estimates, but no such effect was found for disapproval ratings, which tended not to systematically vary with FiveThirtyEight quality rating. On average, a 1-point increase in poll quality rating is associated with a 0.48% point decrease in Trump approval rating. Furthermore, I corroborated previous reports indicating that, on average, Rasmussen polls tend to lead to higher approval ratings for Trump (as well as lower disapproval ratings).
Thursday, May 23, 2019
Jerry Coyne's strategies on evolutionary biology
How does Jerry Coyne on his blog respond to (he would probably say "refutes") claims that we need to change the gene-centered neo-Darwinist view of evolution because of epigenetics and other phenomena? Of course there's more than one answer you can find from posts on his blog. But here are a few recurring ones:
- Ad hominem fallacy: Researchers arguing for the EES and/or a significant role of epigenetic inheritance are biased because they are funded by the Templeton Foundation, whose underlying ideological bias against old-school neo-Darwinism presumably invalidates all research ever funded by them. E.g. "[Proponent of epigenetics Michael] Skinner is eating well from the Templeton trough. It’s pretty clear that Templeton is deeply invested in showing that the “conventional” view of evolution and genetics is wrong, for they’ve also put millions into other researchers to that end."
- More ad hominems include: researchers being biased to exaggerate their conclusions because they want media attention for their claims of a paradigm shift, papers pushing transgenerational epigenetic inheritance are only published because of stupid biased scientists who have an unshakeable belief in this (presumably nonexistent) process, the media and the public's affinity for epigenetics stories, etc.
- Epigenetics is still fundamentally under genetic (DNA) control, so DNA-centrism is still valid. E.g. "the position of and influences on a cell can cause it to acquire methylation marks that turn it into difference courses of development: a liver cell, a kidney cell, a bone cell, and so on. But these changes, all inherited among cells in a single body, have resulted from natural selection: they’re adaptive because having different kinds of cells and tissues is adaptive. What has happened is that the DNA program itself, within the egg, contains information that says “methylate cell X at genes Y and Z if it experiences condition C”, and so on."
- Epigenetic inheritance doesn't last long enough to cause long-term evolution: "...we have no examples of such acquired methylation lasting more than two or three generations, so there’s no evidence that it could serve as a stable basis of inheritance, much less of adaptation."
- Studies supposedly showing that such inheritance exists are "...more often than not flawed, relying on p-hacking, small sample sizes, and choosing covariates, like sex, until you get one that shows a significant effect".
One especially absurd DNA-centric claim Coyne has made which I couldn't believe when I first read it is: "All heritable differences between species, in fact, must reside in the DNA; we know of no cases in which they don’t. Where else could they be?"
I'm sorry, what? We already know more genes doesn't mean more complexity in organisms, so clearly the differences in gene regulatory networks rather than the genes themselves are what really matter in distinguishing species. Rejecting the idea that genes determine phenotypes is crucial to explaining how humans are different from flies/worms/other organisms w/about the same number of genes. "...the amount of direct genetic information present in, say, the human genome (now estimated to be around 30 000 protein-coding genes) is orders of magnitude below what would be necessary to actually specify the spatial location, functionality and connectivity among the trillions of cells that make up a human brain. The answer must be in the local deployment of information that is possible through developmental processes, where the ‘instructions’ can be used in a way that is sensitive (and therefore capable of adjusting) to both the internal and external environments." Moreover, DNA is not the only biological way (not even counting cultural transmission) for information to be inherited.
OK, so what if 3 is true but 4 is false? "...a methylation-sensing gene regulatory circuit centered on a 5-methylcytosine DNA glycosylase gene is required for long-term epigenetic fidelity in Arabidopsis." So you need DNA to make epigenetics stable across generations. But we see Coyne has created a way to potentially disprove him: you would need to show that epigenetics is stable over "more than two or three generations". Of course he claims no one has done this yet, or if they have it's Templeton-funded p-hacking media-attention-seeking garbage, but is this true? To quote the paper I linked to at the top of this paragraph, "In plants, DNA methylation patterns are faithfully inherited over many generations", and we also know this can happen in yeast too. So clearly Coyne is at least slightly wrong. Sometimes critics of this concept will claim it is valid, but only in non-mammal organisms, a view Coyne seems to share, yet again superficially dismissing studies contradicting this view by collectively accusing them of a smorgasbord of different methodological flaws. But of course he couldn't be bothered to go into detail about what these fatal flaws are in each study.
Tuesday, May 21, 2019
A meta-analysis of Joe Biden's support in primary polls.
Update: This meta-analysis is no longer being updated, so "regularly updated" has been removed from the title of this post.
This post outlines the methods and results of a simple meta-analysis of the % support received by Joe Biden in national 2020 Democratic primary polls. Currently, the meta-analysis includes 125 polls, all national polls obtained from FiveThirtyEight's poll aggregator. The effect size is the % of the vote Biden gets in a given poll, and the sample size is just the number of people polled. These polls included a total of 324,920 people. The meta-analysis was carried out in keeping with the instructions outlined here.
Note that I have only ever added polls to this meta-analysis, with one exception: an open-ended ABC/WaPo poll that I removed because it had an unusually high percent of respondents (35%) who said they were undecided, which also resulted in all the candidates' percentages being significantly deflated.
Due to high heterogeneity (I2 = 94.8), a random-effects meta-analysis was performed, yielding an effect summary of 30.5% (95% CI 29.6% - 31.4%). No evidence was found that smaller-sample polls were biased in Biden's favor: on the contrary, there was a moderate positive correlation between sample size and % support for Biden (r = 0.36).
Monday, May 20, 2019
Candidate-specific swing maps from 2016
The map below shows where Trump got a lower % of the vote than Romney (by >1%) in blue and higher % in red. If the diff. is <1% either way, the state is gray. Darkest shade = >10%, then 5-10%, then 3-5%, then 1-3% in decreasing order of darkness/solidness.
What about where Clinton got a higher % of the vote than 2012 Obama (same rules of course, but w/colors reversed regarding higher/lower)?
 This underscores how the 2016 election was indeed a Clinton loss more than a Trump win. Clinton lost a lot more ground in more places than Obama compared to Trump improving on Romney.
What about where Clinton got a higher % of the vote than 2012 Obama (same rules of course, but w/colors reversed regarding higher/lower)?
Monday, March 18, 2019
On the representativeness of exit polls II: the 2018 gubernatorial elections
In my own state, Georgia, Kemp won the governor's race with 50.2% of all votes cast, to Abrams' 48.8%. Using CNN's exit poll to estimate the results yields the following estimates for the gender exit poll:
Kemp = (.52*.46)+(.49*.54) = 50.4%, so 0.2% high.
Abrams = (.46*.46)+(.51*.54) = 48.7%, so 0.1% low.
For age (4):
Kemp = 49.9%, so 0.3% low.
Abrams = 48.8%, so exactly right.
For age (6):
Kemp = 49.7%, so 0.5% low.
Abrams = 48.0%, so 0.8% low.
Using the Excel spreadsheet I just threw together it is easy to calculate estimates for any race if you have the exit poll results (% of voters in each group and voting results by group). If you do it for the FL governor's race (won 49.6%-49.2% by the Republican Ron DeSantis; CNN's exit poll is here), you get this:
Gender: DeSantis = 49.8% (0.2% high), Gillum 48.7% (0.5% low).
Age (4): DeSantis = 49.9% (0.3% high), Gillum 48.8% (0.4% low).
Age (6): DeSantis = 49.0% (0.2% low), Gillum 48.3% (0.9% low).
For this Age (6) poll, the probable reason the estimates for both are a bit low is that 4% of 30-39 year old voters responded "No Answer" when asked who they voted for. Was this because they voted for a third-party/independent candidate, or did they not vote (for governor at least) at all? Probably a combination of both, but some of them probably just didn't answer even though they actually voted for DeSantis or Gillum.
CA: Democrat Newsom won the governor's race in CA with 61.9% of the vote to 38.1% for Republican Cox. Notably, it seems like these were the only two candidates on the ballot because of CA's weird runoff system, so 100% of all votes were for one or the other. Because some exit poll results have at least 1% of respondents refusing to answer we have to make all percentages based on the % of respondents who did answer (100%-the % who didn't answer).
Using CNN's exit poll for that state yields these estimates for the results (all errors are +/- based on value of (estimated-actual)):
Gender: Newsom 60.9% (-1%), Cox 39.1% (+1%)
Age (4): Newsom 60.8% (-1.1%), Cox 39.2% (+1.1%)
Age (6): Newsom 60.7% (-1.2%), Cox 39.3% (+1.2%)
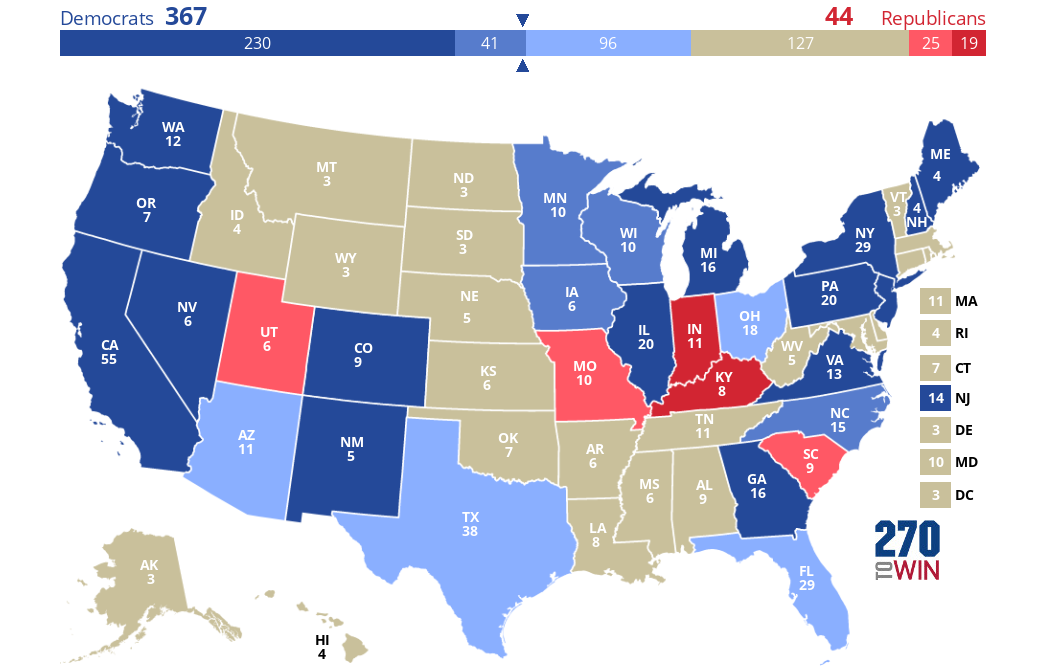
If only X could vote
Based on CNN's exit polls from the 2016 election by state, in the states where these polls were conducted, here are what the results of elections would have been if only members of group X could vote. Light color (red/blue) = less than 5% win, medium = 5-10% inclusive, and dark = 11% or more (if a state margin is between 10 and 11%, it will be medium color; this only applies to Oregon in the first map).
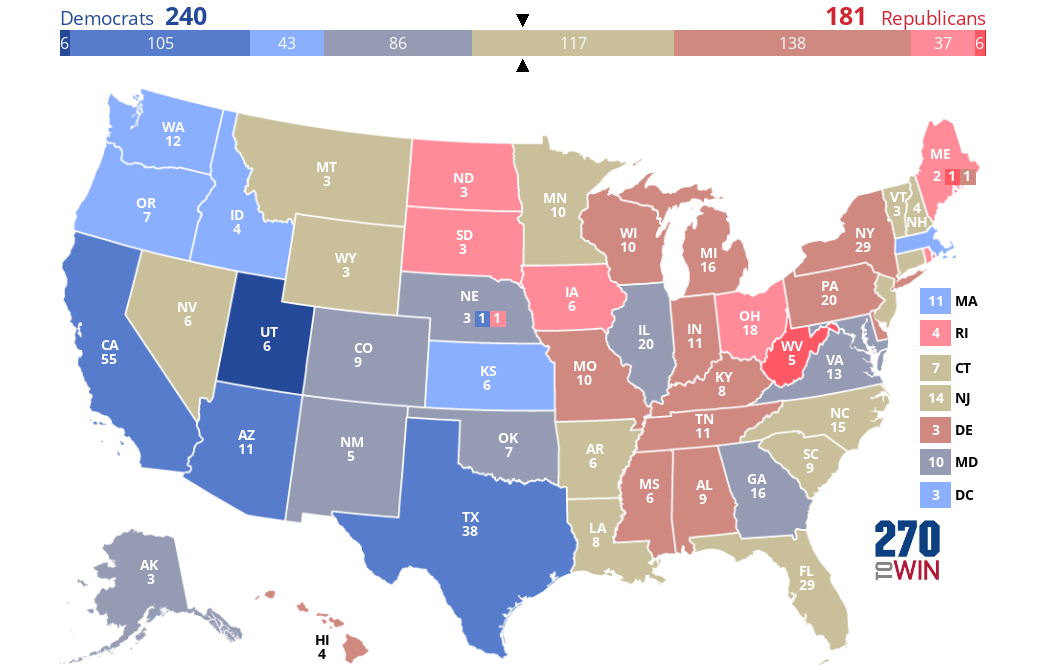
Let's start by taking the actual 2016 EV results (recall they were 306 Trump, 232 Clinton) and grey out all the states that CNN does not have exit polls at all for. As you can see plenty of states are grayed out--mostly ones Trump won in the Great Plains/Western area, as well as some Trump-loving southern states and a few liberal ones in the Northeast. The 2016 exit poll included 28 states, excluding 22 states and DC. In total, we see Trump with 224 EVs and Clinton with 187, so no one has enough to win here:
Note that in the hypothetical scenarios below I will be giving all of Maine's 4 EVs to the same candidate (even though this might not actually happen, and didn't actually happen in 2016).
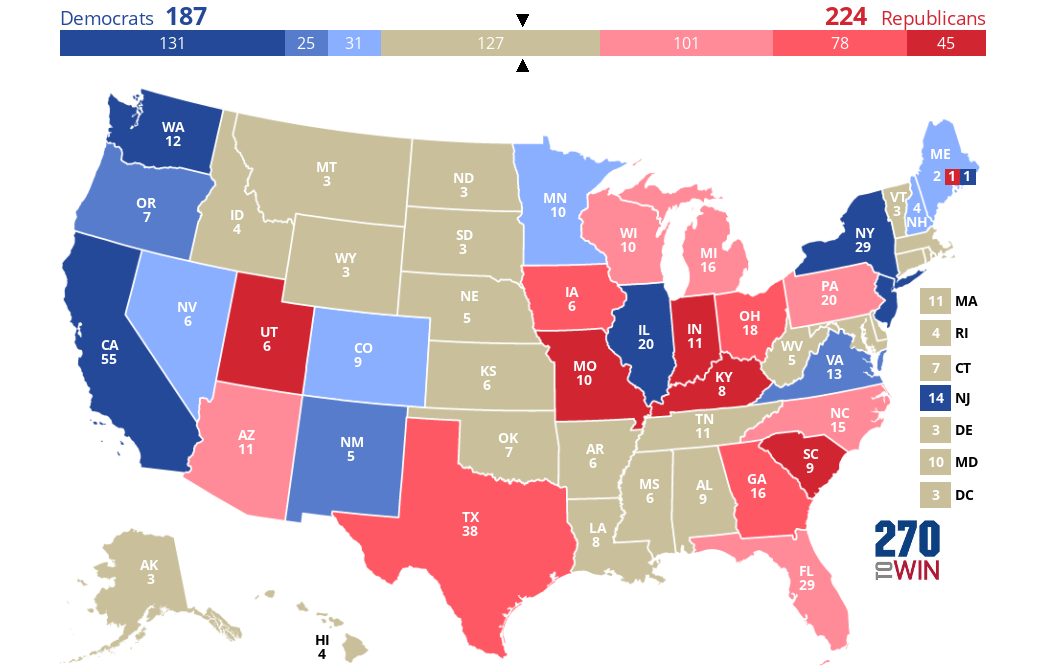
If only men could vote, Clinton would lose 62 EVs in these states, and would win only 125 EVs. Trump, meanwhile, would gain all 62 of these EVs and be able to win the Electoral College even without the excluded states (most of which he actually won anyway). These Trump gains/Clinton losses come from Minnesota, Nevada, Washington state, Colorado, New Mexico, Maine, New Hampshire, and Virginia--Clinton won all of these states but more men voted for Trump than for her in each of them:
Let's start by taking the actual 2016 EV results (recall they were 306 Trump, 232 Clinton) and grey out all the states that CNN does not have exit polls at all for. As you can see plenty of states are grayed out--mostly ones Trump won in the Great Plains/Western area, as well as some Trump-loving southern states and a few liberal ones in the Northeast. The 2016 exit poll included 28 states, excluding 22 states and DC. In total, we see Trump with 224 EVs and Clinton with 187, so no one has enough to win here:
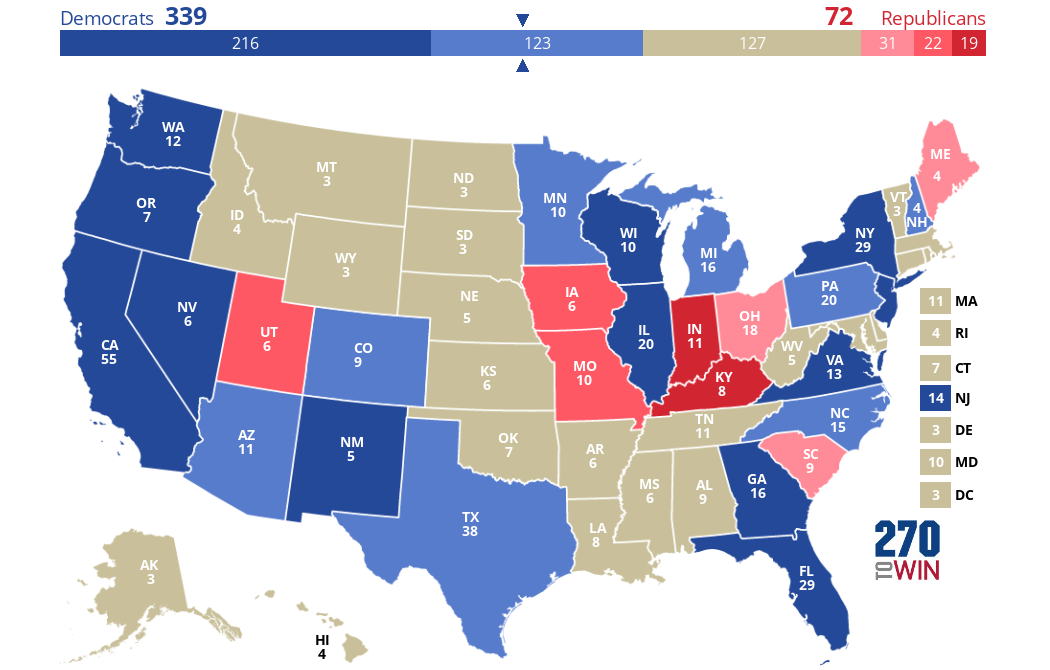
But if only women could vote, unsurprisingly, Clinton would do extremely well, flipping many states Trump won and getting a whopping 367 EVs:
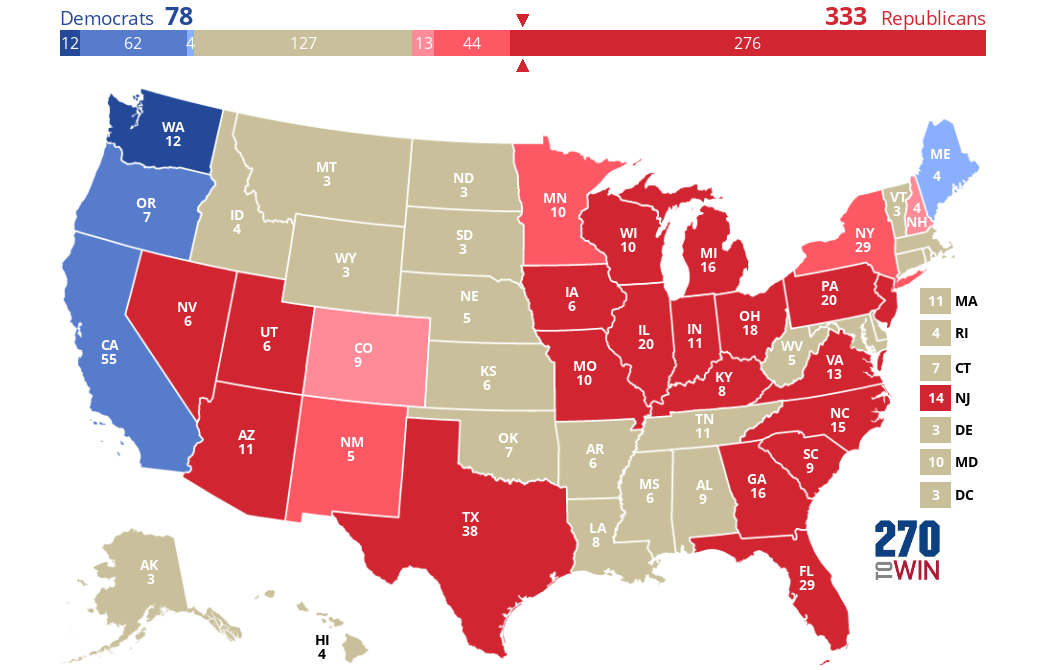
If only white people could vote, the results would be even more favorable to Trump than they were with men. Clinton would hang on to ME and WA, but lose NY, NJ, and even her birth state of IL! The result would be Trump getting a whopping 333 EVs, way more than enough to win:
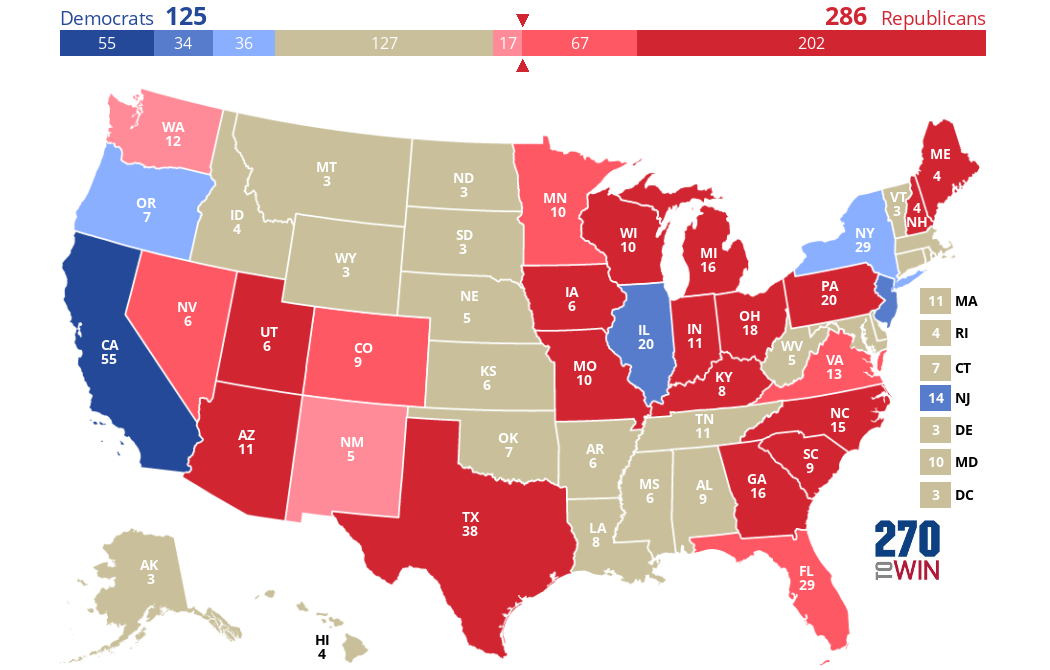
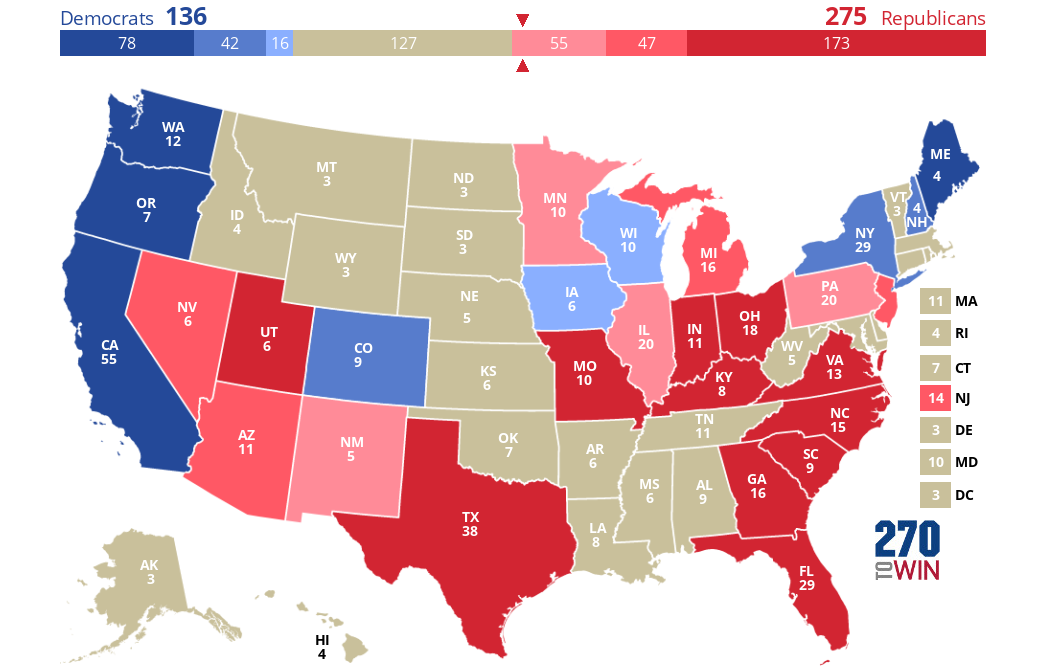
What about if only white women could vote? We've heard a lot about white women since 2016 because most of them voted for Trump that year (despite most women in general voting for Clinton, as usual for Democratic candidates). The results reveal some strange patterns: some states flip in Clinton's favor (IA and WI) compared to the actual results, while other states (e.g. NJ, MN, and IL) actually flip the other way. In all, Trump gets 275 EVs, just enough to win, and Clinton only gets 136. This represents a Republican gain of 51 EVs compared to the actual results (again only based on the states w/exit polls):
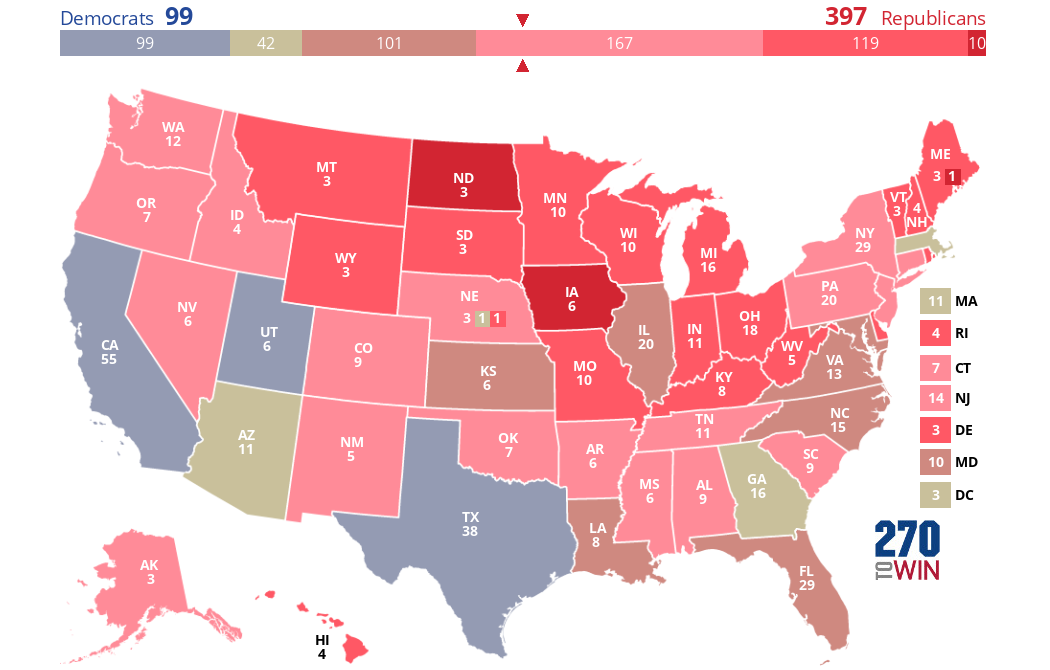
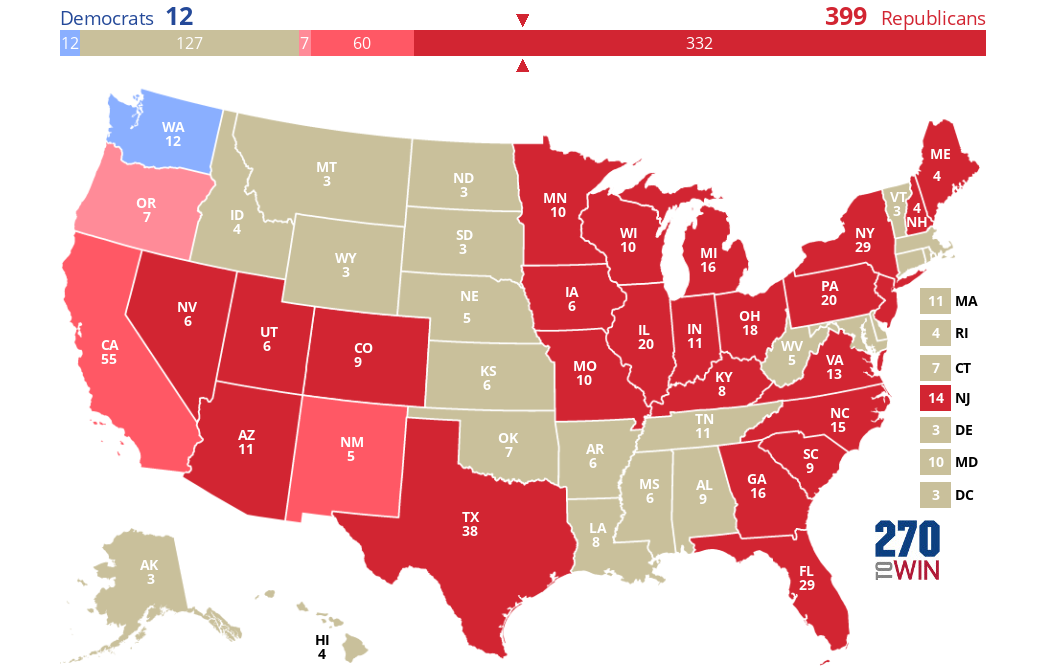
Also, it seems obvious that if only white men could vote, Trump would absolutely crush Clinton almost everywhere, no? Indeed he would have, and the result is so lopsided even I was surprised by it:
Yes, you're reading that right: the only state (included in CNN's exit polls) where more white men voted for Clinton than Trump is Washington state! So of course Trump would win easily in this scenario, with a whopping 399 EVs compared to only 12 for Clinton.
If only people aged 18-45 could vote, Clinton, no surprise, would do very well, winning all but 8 states included here. This would result in her getting 339 EVs, 152 more than she actually got in the included states. Oddly, one state would actually flip from Clinton to Trump if only those under the age of 45 could vote: Maine.
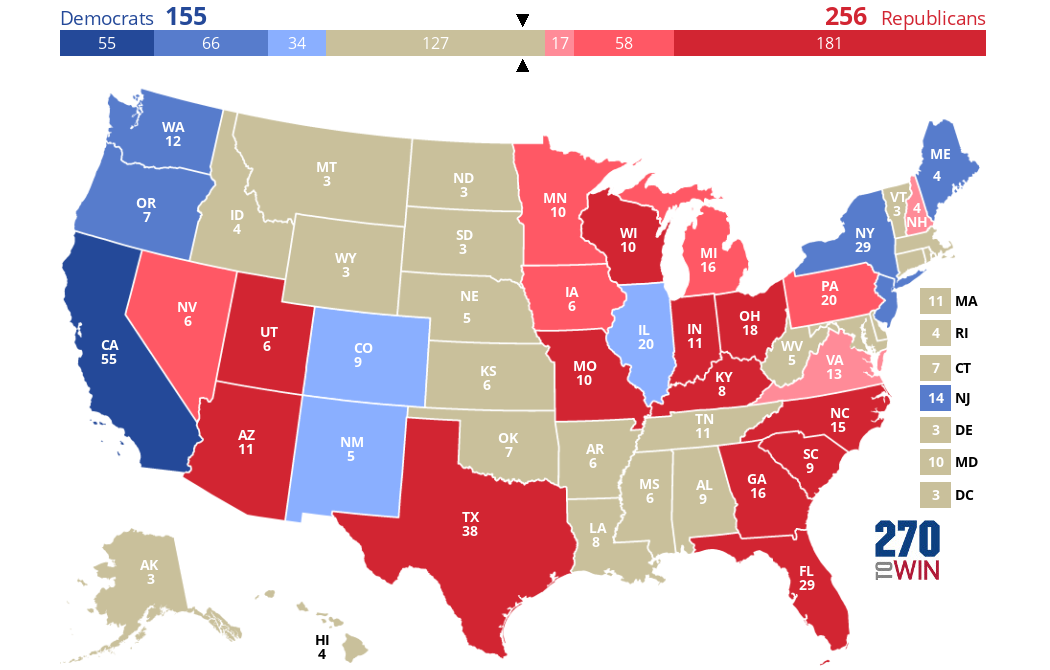
But if only people 45 or older could vote, we would see Clinton lose a bit of ground relative to her real performance.
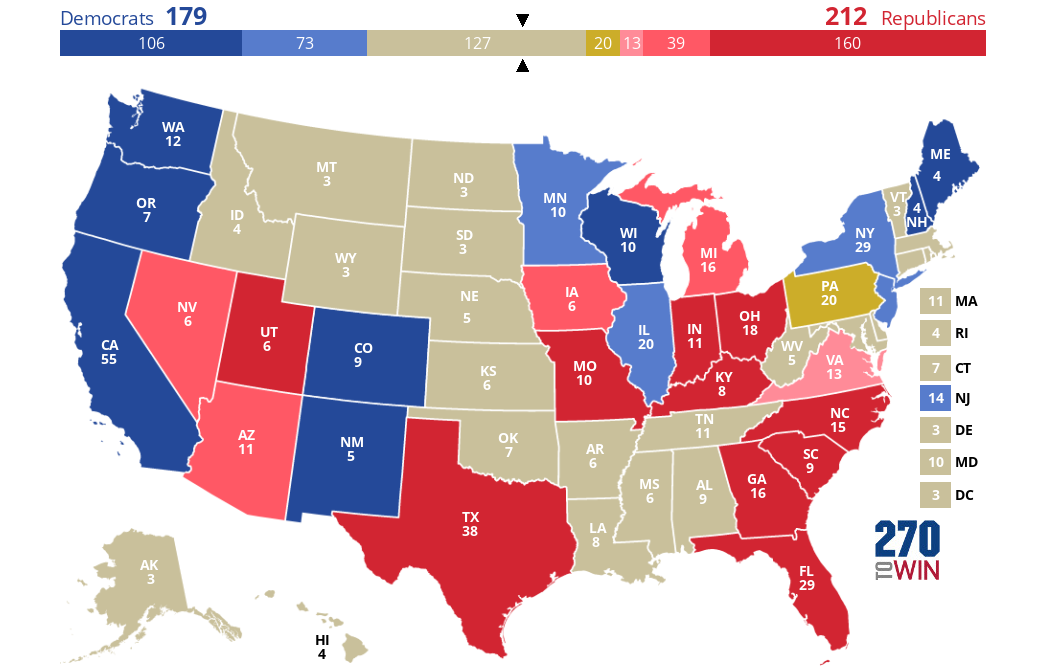
Finally, if only white people with college degrees could vote, Trump would get 212 EVs (12 less) to Clinton's 179 (8 less). Note that Pennsylvania is marked "other"; this is because the white college graduate vote was split exactly evenly (48-48) in that state.
In conclusion, ranking demographic groups from most to least Republican gives this result:
- White men
- White people overall
- Men overall
- White women
- People 45/older
- The American electorate overall
- White college graduates
- People under the age of 45
- Women overall
Monday, March 11, 2019
Why do hereditarians love the word "empirical" so much?
In this post I cite examples of hereditarian IQ/race/genetics researchers (Robert Plomin, Ian Deary, etc.) using appeals to "empirical" evidence to support their views. Their use of the word "empirical" specifically to defend themselves against their critics recurs weirdly often to the point where they seem to "get off" on using this word. And often their uses of it seem entirely redundant in the context in question. All emphases that follow are mine.
Example 1: "Concerning the equal environments assumption in general, empirical data based on most twin studies ever published point to little or no influence of shared environmental factors on twin similarity" (Arden et al. 2016).
Example 2: "A theoretical logic provides a useful framework for considering the empirically discovered links between intelligence and health. This framework is useful in generating empirical research questions such as ours" (Arden et al. 2016).
Example 3: [After describing E.G. Boring's 1923 quote "Intelligence is what the tests test"] "The apparently dismissive comment
came after a summary of strong empirical findings — for example, that the tests
showed marked individual differences, that the differences were stable over time, that
children developed greater intelligence over time but tended to maintain the same
rank order" (Deary et al. 2010, p. 202).
Example 4: "[Psychologist Howard] Gardner has intentionally avoided empirical tests of his theory [of multiple intelligences or MI], but those that have been made show most
of his MI to be correlated with one another...The theories that do not accommodate this finding [referring to the positive correlations between different mental tests] — such as those of Thurstone, Guilford, Sternberg
and Gardner — fail the most basic empirical tests" (Deary et al. 2010, p. 204).
Example 5: "More than 100 years of empirical research provide conclusive evidence that a general factor of intelligence (also known as g, general cognitive ability, mental ability and IQ (intelligence quotient)) exists, despite some claims to the contrary" (Deary et al. 2010, "Key points").
Example 6: "...we estimated the heritability of height from empirical genome-wide identity-by-descent sharing..." (Visscher et al. 2006)
Example 7: "...the empirical variance of IBD sharing is likely to be an underestimate because the marker information was not perfect" (Visscher et al. 2006).
Example 8: "They also failed to highlight that the theoretical discussion actually revolved around
an empirically testable question...To conduct the test, I drew on an empirical model..." (Littvay 2012)
Example 9: "The findings place the burden on critics to present theoretical work on the specific mechanisms of EEA violations based on which additional empirical assessments could (and should) be conducted." (Littvay 2012)
Example 10: "...these criticisms, like most of the literature questioning the validity of the EEA [equal environments assumption], are made on the basis of secondary analysis of published research, not on the basis of empirical examination of CTD [classical twin design] assumptions on political variables." (Smith et al. 2012, p. 19)
Sunday, March 3, 2019
On the representativeness of exit polls I: the 2016 general presidential election
If exit polls are perfectly representative of the electorate, then calculating the percent of votes each candidate received in a given state from the exit polls conducted there should exactly match the actual percent of the vote each candidate actually received in that state. So I'll try to do exactly that here from the 2016 exit polls conducted by CNN.
I will start with my own state, Georgia. So what actually happened in this state was that Trump got 50.4% of the vote, while Clinton got 45.3%. So if we look at the gender exit polls for Georgia, we see the following:
I will start with my own state, Georgia. So what actually happened in this state was that Trump got 50.4% of the vote, while Clinton got 45.3%. So if we look at the gender exit polls for Georgia, we see the following:
- 55% of voters were female, 45% were male.
- Of the female voters, 54% voted for Clinton, while 43% chose Trump.
- Conversely, of the male voters, 60% chose Trump while only 37% chose Clinton.
So, assuming we are focusing only on Georgia, let M be the event that a election voter is a male, C be the event that they voted for Clinton, and T be the event that they voted for Trump. The exit polls thus indicate that:
- P(M) = 0.45,
- P(C|M) = 0.37,
- P(T|M) = 0.6,
- P(F) = 0.55,
- P(C|F) = 0.54, and
- P(T|F) = 0.43.
So we can estimate Trump's total vote share from these data by multiplying the % of voters who were of each sex by the % of each sex who voted for him. Doing this gives (45%*60%)+(55%*43%)=27.0%+23.7%=50.7%. This matches up quite nicely with the actual percent of the vote he got in Georgia (it's only 0.3% higher than his actual result of 50.4%), so the poll appears to be quite representative.
But what about Clinton? Let's do the same thing for her:
(45%*37%)+(55%*54%)=16.7%+29.7%=46.4%. This is 1.1% higher than the 45.3% of the vote Clinton actually got, so it's a little further off than with Trump.
What about race? 60% of those in the exit poll were white, and 30% were black. But let's break everyone into a dichotomous category of white vs. non-white, as CNN does for some of their exit polls. So we have 60% white voters and 40% non-white voters. Needless to say, Trump did much better among white voters than among non-white voters: he got 75% of the white vote but only 14% of the non-white vote.
This indicates that Trump would receive (60%*75%)+(40%*14%)=45%+5.6%=50.6%. Again, we are very close (only 0.2% away) to Trump's actual result of 50.4%. For Clinton, she got only 21% of the white vote but 83% of the non-white vote. This points to (60%*21%)+(40%*83%)=45.8% of the vote. This is also close to (0.5% more than) the 45.3% of the vote she actually got.
Lastly, age. Let's again split people into two categories: 18-44 and 45 and older. Of 18-44 year olds, Clinton beat Trump 55 to 40. But among those 45 and older, Trump beat Clinton 60 to 38. 46% of voters were 18-44 and the remaining 54% were 45 and older.
So this indicates that Clinton got 45.8% of the vote, again 0.5% more than the actual amount. Trump would be predicted to get 50.8% of the vote, or 0.4% more than he actually got.
If you use the data broken down by six different age groups instead, you get a Clinton prediction of 46% and a Trump prediction of 50.68%.
All of my results for Georgia are shown in the table below. The parentheses in the left column are the number of categories each set of results is broken down into (e.g. Race (2) = just "white" and "non-white").
| Georgia | C | T | How far off (Clinton)? | How far off (Trump)? |
| Actual | 45.3% | 50.4% | ||
| Sex | 46.4% | 50.7% | 1.1% | 0.3% |
| Race (2) | 45.8% | 50.6% | 0.5% | 0.2% |
| Age (2) | 45.8% | 50.8% | 0.5% | 0.4% |
| Age (6) | 46.0% | 50.7% | 0.7% | 0.3% |
| Age (4) | 46.2% | 50.6% | 0.9% | 0.2% |
| Race (5)* | 42.0% | 48.8% | -3.3% | -1.6% |
| Race & gender | 43.8% | 50.3% | -1.5% | -0.2% |
*I should note here that this was broken down into 5 categories, but there are 2 ("Asian" and "Other race") with no results given for how they voted. This explains why the estimates based on these specific polls are both much lower than the actual results.
Next I chose Arizona solely because it's the first state listed on CNN's exit poll page (they're listed alphabetically and they didn't do AL or AK for some reason). Note that with many of these poll results you also have significant percentages of the voters for which there are no estimates of how they voted (these will all be denoted with an asterisk). Specifically, for AZ, there were no voting data for 14% of the voters in the Age (6) poll, for 9% of those in the Race (5) poll, and for 9% of those in the Race & gender poll. This leads to estimates of the results (% of all votes for each candidate) that are always somewhat lower than the actual values. That being said, my results are here:
| Arizona | C | T | How far off (Clinton)? | How far off (Trump)? |
| Actual | 44.6% | 48.1% | ||
| Sex | 44.6% | 48.9% | 0.0% | 0.8% |
| Race (2) | 44.8% | 48.5% | 0.2% | 0.4% |
| Age (2) | 44.7% | 48.9% | 0.1% | 0.8% |
| Age (6)* | 37.6% | 44.3% | -7.0% | -3.8% |
| Age (4) | 44.4% | 48.5% | -0.2% | 0.4% |
| Race (5)* | 39.2% | 45.2% | -5.4% | -3.0% |
| Race & gender* | 39.7% | 44.6% | -4.9% | -3.5% |
| Education (4) | 44.7% | 48.8% | 0.1% | 0.7% |
| Education (2) | 44.5% | 48.5% | -0.1% | 0.4% |
From this we see clearly that these polls seem to be quite representative of the entire electorate in these two states. In almost all cases without a lot of missing data, we see errors of less than 1 percent! In all cases without entire groups where we have no clue how they voted, we see errors of less than 2%.
Let's look at the entire country now. Overall, Trump received about 45.9% of the popular vote in the US as a whole, and Clinton received 48.0%. Conveniently, we can include not just CNN's national exit poll results, but also the New York Times'.
Lastly, I included California exit poll results (also from CNN) because it is the most-populated state, so surely they should be especially accurate there.
My results for the entire country, as well as for AZ, CA, and GA, are shown below. Note that these results include only the MOV as estimated from each exit poll category (sex, race (2), etc.), not the % estimated for either candidate. Overall we see that the exit polls seem to be very representative. We see that excluding missing data (corresponding to all values shown in red below) makes both the AZ and CA exit polls more accurate, but it has no effect for the national polls for the simple reason that missing data was nonexistent for these polls, and for GA this exclusion actually made the estimated MOV less accurate.
Lastly, CNN's national exit poll matched the actual results much more closely than did the Times'. Why? CNN's national poll was based on 24,558 respondents, while the Times' was apparently based on 24,537. It seems unlikely that those 21 extra voters made such a big difference in accuracy between the two polls. Additionally, at the bottom of the page for the Times' poll, it says: "Data for 2016 were collected by Edison Research for the National Election Pool, a consortium of ABC News, The Associated Press, CBSNews, CNN, Fox News and NBC News." This seems to imply that the source for CNN's and the Times' exit poll data is actually exactly the same. Why the results are slightly different, then, is not clear (e.g. CNN says Trump got 52% of the male vote, Times says 53%).
| MOV | AZ | CA | GA | National (NYT) | National (CNN) |
| Sex | -4.3% | 28.7% | -4.3% | 0.5% | 1.7% |
| Race (2) | -3.8% | 29.4% | -4.8% | 0.0% | 1.2% |
| Age (2) | -4.3% | 29.7% | -5.0% | 0.0% | 1.7% |
| Age (6) | -6.7% | 29.6% | -4.7% | 0.0% | 1.6% |
| Age (4) | -4.1% | 29.5% | -4.5% | 0.6% | 1.8% |
| Race (5) | -6.0% | 28.1% | -6.8% | 0.9% | 1.8% |
| Race & gender | -4.9% | 24.7% | -6.4% | 0.0% | 1.9% |
| Education (4) | -4.1% | 28.2% | -4.5% | 1.1% | 1.9% |
| Education (2) | -3.9% | 28.6% | -5.0% | 0.0% | 1.5% |
| Average | -4.7% | 28.5% | -5.1% | 0.3% | 1.7% |
| Average (excl. miss.) | -4.1% | 29.1% | -4.7% | 0.3% | 1.7% |
| Actual MOV | -3.5% | 30.0% | -5.1% | 2.1% | 2.1% |
Tuesday, February 12, 2019
Emil Kirkegaard's self-citations
I recently looked at every paper Kirkegaard lists on his Google Scholar profile as having 1 or more citations. I aimed to determine how many of his 404 total listed citations were self-citations (i.e. citations in papers he authored/co-authored). The answer was remarkably high: 316 (78%). The spreadsheet in which I compiled these results is copied and pasted below, with each paper numbered according to its position when all papers are ranked in descending order of citation count. I lumped the six top ones together because I looked at their self-citation numbers before looking at the rest of them.
| Total cites | Self-cites | |
| Top 6 | 164 | 112 |
| 7 | 13 | 12 |
| 8 | 11 | 8 |
| 9 | 11 | 10 |
| 10 | 10 | 2 |
| 11 | 10 | 10 |
| 12 | 10 | 10 |
| 13 | 9 | 8 |
| 14 | 9 | 9 |
| 15 | 9 | 7 |
| 16 | 9 | 6 |
| 17 | 8 | 7 |
| 18 | 8 | 8 |
| 19 | 7 | 7 |
| 20 | 7 | 5 |
| 21 | 6 | 3 |
| 22 | 6 | 5 |
| 23 | 6 | 6 |
| 24 | 6 | 6 |
| 25 | 6 | 6 |
| 26 | 6 | 6 |
| 27 | 5 | 4 |
| 28 | 5 | 5 |
| 29 | 4 | 4 |
| 30 | 4 | 3 |
| 31 | 4 | 4 |
| 32 | 4 | 4 |
| 33 | 4 | 4 |
| 34 | 4 | 4 |
| 35 | 4 | 4 |
| 36 | 4 | 4 |
| 37 | 3 | 3 |
| 38 | 3 | 3 |
| 39 | 3 | 1 |
| 40 | 2 | 2 |
| 41 | 2 | 2 |
| 42 | 2 | 2 |
| 43 | 2 | 1 |
| 44 | 2 | 0 |
| 45 | 1 | 1 |
| 46 | 1 | 1 |
| 47 | 1 | 1 |
| 48 | 1 | 1 |
| 49 | 1 | 1 |
| 50 | 1 | 0 |
| 51 | 1 | 0 |
| 52 | 1 | 1 |
| 53 | 1 | 0 |
| 54 | 1 | 1 |
| 55 | 1 | 1 |
| 56 | 1 | 1 |
Wednesday, February 6, 2019
The "Trump economy": fact or fiction?
Has President Trump actually improved the state of the U.S. economy above and beyond what would be expected if the trends that occurred under President Obama simply continued unchanged? He regularly claims as much (including in yesterday's State of the Union), as do many of his supporters, so it seems useful to determine to what extent this claim is true. This post aims to answer this question by focusing on the national unemployment rate.
The right-wing hashtag #jobsnotmobs, which was widely shared on Twitter during the elections last year, seems to suggest that Trump's policies have benefited American workers by reducing the unemployment rate. This claim can be tested empirically using the "interrupted time series" design. This method involves looking at trends before an intervention, then comparing them to the trends after an intervention, to see what effect (if any) the intervention had on the outcome being measured.
Monthly national unemployment data were downloaded from the Bureau of Labor Statistics website. The pre-Trump trend in the unemployment rate, because Obama is typically credited by Trump's critics for the economic improvements that have taken place since Trump took office, will be defined based on the start and end of the Obama administration. For this part, I will be generous to Trump and give him credit for all economic trends that happened from Nov. 2016 onward, even though he didn't take office until January 2017 and Nov. 2016 includes a week before Trump won the election. This yields two possible definitions of the "pre-Trump" period:
- Jan. 2009 - Oct. 2016 (inclusive)
- Feb. 2009 - Oct. 2016 (inclusive)
What if you wanted to include all months before Trump's first month in office (Jan. 2017)? Then you get these definitions (also inclusive):
3. Jan. 2009 - Dec. 2016
4. Feb. 2009 - Dec. 2016
For definition 1, the monthly pre-Trump decline in unemployment rates is -0.031%, and for definition 2, it is -0.037%. For definitions 3 and 4, the decline is -0.033% and -0.038%, respectively. These values yield an average pre-Trump monthly unemployment decline (MUD) of -0.035%.
Now what has happened since Trump took office? Has the unemployment rate started plummeting at a much, much faster rate than back when that evil socialist Obama was president? No, not at all: If you measure starting from November 2016, unemployment rates have declined at a monthly rate of -0.027%, from January 2017, -0.029%, and from February 2017 (his first full month in office), -0.03%, for an average post-Trump MUD of -0.029%. (Note that "post-Trump" means "post-election of Donald Trump", i.e. the time since it became clear he would be the next president of the USA.) These results, thus, provide no support whatsoever for the hypothesis that Trump has "reduced unemployment", that is, decreased the national unemployment rate below what would be expected if nothing changed from Obama's presidency.
Next, I examined trends in the number of jobs created, also based on a BLS dataset that I downloaded. The pre-Trump trend (Jan '09-Oct. '16) in this number is +10,100/month, and that from Feb. '09 to Oct. '16 is +9,800/month. The pre-Trump trend from Jan. '09-Dec. '16 is +10,500, and that from Feb. '09 to Dec. '16 is +10,200/month. These values yield an average pre-Trump trend of +10,000 jobs/month. The post-Trump trend (Nov. '16-Jan. '19, "definition 1", including both Jan. '19 and Dec. '18, which both only have "preliminary" data according to the BLS) is +5,200 jobs/month, or if you start on Jan '17 (definition 2), +2,200, or if you start on Feb. '17 (definition 3), +7,100, for an average post-Trump trend of +4,800 jobs/month. Clearly, then, we have not seen the job creation rate increase on average since, much less as a result of, the election or inauguration of Donald Trump.
Meanwhile, given that this time series is highly variable from one month to the next, I calculated the average numbers of jobs created/month for the four definitions of the "pre-Trump" period listed above. For definitions 1, 2, 3, and 4, the average number of jobs created/month in the pre-Trump period were 109,000, 118,000, 110,000, and 120,000, respectively, for an average of +114,000 jobs/month. In the post-Trump period, the averages for the three definitions are 204,000, 205,000, and 203,000, respectively, for a total average of +204,000 jobs/month added in the Trump presidency. This looks like clear evidence that Trump increased the number of jobs, but much of this large discrepancy is clearly driven by the Great Recession that Obama inherited in the first year or so of his presidency.
Wednesday, January 30, 2019
How do behavior geneticists respond to epigenetics?
Having read a very considerable amount of literature on human genetics, epigenetics, behavior genetics (BG), genetic determinism, etc. in the past six months or so I was often struck by the apparent failure of behavioral geneticists to adequately address conceptual criticisms of their methodologies in general. One specific criticism that they appeared not to have devoted much effort to addressing nearly adequately was that the idea of relative, separable contributions of genes versus environment to (variation in) complex behavioral traits is no longer scientifically tenable. One line of evidence, on which I will focus here, often cited to support this claim is that of the field of epigenetics. Why is this a problem for BG (if the critics are to be believed, anyway)? I will try to break this question down before getting into responses to objections:
The first answer to the above question is that BG is fundamentally focused on DNA as though it was the only way that human traits could be biologically transmitted across generations. But Charney (2012a) has noted:
So what does this all mean? It means that you can't just focus on the DNA, you must also focus on epigenetic processes as means of transmitting biological "information" through generations. Right? And it also looks like epigenetic processes can both alter DNA expression and be changed by environmental factors. This latter phenomenon, if it is true, means changes in the environment could indirectly led to changes in expression of DNA, meaning that the environment can affect genes. Surely this means that it is meaningless to refer to "genes" vs. "environment" as separate when this relationship demonstrates that they are anything but, with changes in the latter capable of changing expression of the former?
Maybe not: one common tactic of BG researchers when confronted with the supposed existence of transgenerational epigenetic inheritance is to say "nuh-uh!". More precisely they tend to argue that the evidence for epigenetic inheritance allowing traits to be inherited without DNA sequence changes is weak or nonexistent. For example, Barnes et al. (2014) claim,
Similarly, Battaglia (2012) noted, "the relationship between widespread epigenetic marks and genetic expression is still controversial." This particular paper was also cited by Liu & Neiderhiser (2017, p. 100), who also make a very similar point in saying (p. 101), "findings from epigenetic studies are still controversial and inconsistent, especially in humans".
Let's return to Liu & Neiderhiser (2017), a book chapter that goes into more detail than anything else I've seen in "debunking" conceptual criticisms of BG. This same chapter states (pp. 100-101): "...proponents of an epigenetic approach would expect that the environ mental and behavioral inputs over time would contribute to increasing variation in gene expression, thus decreasing the phenotypic concordance among MZ and DZ twin pairs. However, this prediction is not consistent with the finding that for intelligence, the degree of similarity among MZ twin pairs increases throughout the life span and the heritability of intelligence continues to increase linearly with age". This argument is also made by Battaglia (2012). Charney (2012b) responds to Battaglia by saying the following:
More criticisms of the argument that epigenetics has significant effects that are relevant to BG are made by Moffitt & Beckley (2015). First, they claim, "...methylation is ubiquitous and normative, and usually it has nothing to do with experience but is part of organism development that is, incidentally, under genetic control. Because the genome is identical in each of our cells, during normal development, most of our genes must be methylated, lest a kidney cell grow into an eye or a fingernail cell grow into an ear. Against this normative background, methylation marks that can be statistically associated with external experience are relatively rare, and effect sizes are expected to be small." They also have six more criticisms of epigenetics-centered human behavioral research, but criticisms 2-4 inclusive are all technical and centered around whether such research is feasible, not whether there is strong evidence for the reality of epigenetic effects on DNA expression and thus on behavior.
Before moving onto Moffitt & Beckley's last 2 objections, I will note something about the first sentence in the quote I cited in the above paragraph. They claim that methylation is part of the development of the organism, and that (this is crucial) this development is "under genetic control". Really? In any case, DNA methylation is only one kind of epigenetic process: there are also other processes like histone acetylation, "histone methylation, phosphorylation, or ubiquitination, to name a few" (Moore 2017). Thus, it is weird that Moffitt & Beckley devote 100% of their epigenetic-related attention in their article to DNA methylation. Moreover, they are claiming that environmental factors do not significantly affect DNA methylation and that this process does not significantly vary from a baseline level, but they do not cite any sources to support this claim.
What is objection 5? Here's an excerpt: "...although a small set of nonhuman studies provide initial evidence that experience can apparently alter methylation, it is far from clear that the detected methylation alterations have any consequences for health or behavior. Before methylation can affect health or behavior, it must alter expression of genes. Links from methylation data forward to gene expression data are not yet known." This is also an argument from Battaglia (2012). Charney (2012b) responded to Battaglia's argument that there is not very much evidence that epigenetics affects human behavior by saying,
But it is important to remember that, as Lester et al. (2016) have pointed out, "the use of epigenetics to study human behavior is just beginning". In other words, there is no question that there is still a lot we don't know in regards to human behavioral epigenetics. Does this mean we should assume it is totally irrelevant to the study of human behavior? This question may seem stupid--"Of course we shouldn't!"--but in fact it is pretty important here. The critics of BG contend that epigenetics demonstrates that the environment can affect what genes do (i.e. how they are expressed) regarding behavior. But the researchers who want to treat genes and environment as separate (though this practice is scientifically indefensible) can just say there's not enough evidence that these effects exist, or even if there is, there's not enough evidence they actually significantly affect human behavior, or even if there is, we can use mathematical simulations that bear no relationship to what is actually happening in the real world to "show" that this only results in a slight change in heritability estimates from classical twin studies (Liu et al. 2018). We see that BG defenders thus have several stages of "fall-back" arguments when confronted with evidence about the inseparability of genes vs. environment.
There are also some baseless arguments-by-assertion merely claiming, with no supporting evidence, that epigenetic processes and their ability to mediate environmental effects on gene expression do not pose a fatal problem for BG studies. Here's an example from a response of some BG researchers to critiques (McGue et al. 2005): "Although the study of epigenetic phenomena may provide a powerful paradigm for developmental psychology, it will not obviate the need for twin, adoption, and family research like that reflected in our article (McGue et al., 2005)." This strange and totally unsupported argument has made its way elsewhere: Liu & Neiderhiser (2017, p. 100) cite McGue et al. (2005) and make the same exact claim with no additional support.
Other fallacies that rear their heads in the responses-to-epigenetics literature include the good-old-fashioned straw man. For example, you could construct a straw man version of epigenetics and developmental systems theory, and the associated schools of thought, according to which proponents of these ideas believe that DNA is totally irrelevant to human behavior. Of course, like any good straw man, this is a totally inaccurate representation of these people's views, but that doesn't stop Liu & Neiderhiser (2017, p. 100) from informing us that "DNA sequence variations are important and will continue to be important." Duh! Who are these imaginary epigenetics proponents claiming that DNA should be ignored entirely? They don't exist! If you wanna know what these individuals actually believe, maybe read some of their work, such as a recent paper by Overton & Lerner (2017, p. 117):
But BG researchers always have one more consistent "out" when confronted with epigenetics: claim that it can be incorporated into BG research. This is one of the most common answers to the question that forms the title of this post. Liu & Neiderhiser (2017), for instance, after casting doubt on the importance and DNA-independence of human epigenetics for almost two full paragraphs, tell us (p. 101), "In sum, we wish to emphasize that family-based behavioral genetic approaches are a promising way to study complex epigenetic effects and gene expression." This message seems oddly inconsistent with what they said in the previous dozen sentences or so, but OK. Moffitt & Beckley make a similar but distinct suggestion: that twin studies be used not to estimate heritability (their most common purpose historically), but to rule out potential confounding factors and biases:
The first answer to the above question is that BG is fundamentally focused on DNA as though it was the only way that human traits could be biologically transmitted across generations. But Charney (2012a) has noted:
"DNA can no longer be considered the sole agent of inheritance...The epigenome, that is, the complex biochemical system that regulates DNA expression, turning genes on and off and modulating their “transcribability,” has been found to be heritable, both somatically and intergenerationally via the germline, enabling the biological inheritance of traits with no changes to the DNA sequence. Furthermore, the epigenome is highly environmentally responsive. Environmentally induced changes in gene transcribability can have long-term – sometimes lifelong – phenotypic consequences."
So what does this all mean? It means that you can't just focus on the DNA, you must also focus on epigenetic processes as means of transmitting biological "information" through generations. Right? And it also looks like epigenetic processes can both alter DNA expression and be changed by environmental factors. This latter phenomenon, if it is true, means changes in the environment could indirectly led to changes in expression of DNA, meaning that the environment can affect genes. Surely this means that it is meaningless to refer to "genes" vs. "environment" as separate when this relationship demonstrates that they are anything but, with changes in the latter capable of changing expression of the former?
Maybe not: one common tactic of BG researchers when confronted with the supposed existence of transgenerational epigenetic inheritance is to say "nuh-uh!". More precisely they tend to argue that the evidence for epigenetic inheritance allowing traits to be inherited without DNA sequence changes is weak or nonexistent. For example, Barnes et al. (2014) claim,
"...epigeneticists are urging social scientists to be more cautious when discussing epigenetic influences on social behavior. In the words of two preeminent epigeneticists, Heijmans and Mill (2012: 4): “[E]pigenetics will not be able to deliver the miracles it is sometimes claimed it will.” Perhaps unknown to sociologists who have hung their future of the field on epigenetics, epigeneticists are confronted with the same problems genomic and biosocial scientists are encountering."
Similarly, Battaglia (2012) noted, "the relationship between widespread epigenetic marks and genetic expression is still controversial." This particular paper was also cited by Liu & Neiderhiser (2017, p. 100), who also make a very similar point in saying (p. 101), "findings from epigenetic studies are still controversial and inconsistent, especially in humans".
Let's return to Liu & Neiderhiser (2017), a book chapter that goes into more detail than anything else I've seen in "debunking" conceptual criticisms of BG. This same chapter states (pp. 100-101): "...proponents of an epigenetic approach would expect that the environ mental and behavioral inputs over time would contribute to increasing variation in gene expression, thus decreasing the phenotypic concordance among MZ and DZ twin pairs. However, this prediction is not consistent with the finding that for intelligence, the degree of similarity among MZ twin pairs increases throughout the life span and the heritability of intelligence continues to increase linearly with age". This argument is also made by Battaglia (2012). Charney (2012b) responds to Battaglia by saying the following:
"Both Battaglia and MacDonald & LaFreniere argue against the claim that MZ twins become more epigenetically and genetically discordant over their lifetimes by citing studies that purport to show that heritability increases with age. I am not sure if their claim is that these studies demonstrate that epigenetic discordances of MZ twins do not, in fact, increase over time, or that, although they may increase over time, they have no effect upon phenotypes. If the former, then clearly the results of a twin study cannot refute the existence of increasing epigenetic discordance, a phenomenon that has been repeatedly demonstrated by advanced molecular techniques (Ballestar 2009; Fraga et al. 2005; Kaminsky et al. 2009; Kato et al. 2005; Martin 2005; Mill et al. 2006; Ollikainen et al. 2010; Petronis et al. 2003; Poulsen et al. 2007; Rosa et al. 2008). To deny this would require a refutation of these studies. So, I take the argument to be the latter, namely, that studies that purport to show that heritability increases with age demonstrate that whatever epigenetic (and genetic) changes MZ twins experience over their lifetimes have no effect upon, for example, cognitive development.
Such generalizing from one or two studies concerning one or two phenotypes to all behavioral phenotypes is a common practice in the twin study literature, and it is also an example of the fallacy of “hasty generalization.” Given that the results of a number of other twin studies draw the opposite conclusion–that heritability decreases with age–including the heritability of cognitive ability, such an argument in this context is perhaps more accurately characterized as an instance of the fallacy of neglect of relevant evidence. For example, according to Reynolds et al. (2005):
As the number of waves of data collection in longitudinal twin studies has increased, behavior genetic analyses of changes with age have begun to be conducted. Results suggest strong genetic influences on stability (Plomin et al. 1994) over the short term. Initial cohort-sequential analysis suggested a decline in heritability of IQ from age 60 to age 80 (Finkel et al. 1998), a conclusion that has been supported by cross-sectional results from other twin studies of aging (McClearn et al. 1997; McGue & Christensen 2002). (Reynolds et al. 2005, p. 3)
And as Reynolds et al. (2005, p. 13) note of their own study: “The findings of the present study can be construed as generally supportive of theories proposing the increasing importance of the environment with respect to cognitive aging: Although heritable influences are of greater relative importance for individual differences in cognitive performance, environmental variances increase steadily after age 65.” Other twin studies have reported decreasing heritability for personality (Floderus-Myrhed et al. 1980; Pedersen et al. 1988), science scores (Haworth et al. 2009), extraversion and introversion (Viken et al. 1994), self-esteem (Jonassaint 2010; Raevuori et al. 2007), body mass index (Korkeila et al. 1991), and anxiety/depression (Saviouk et al. 2011)."
So Charney's (2012b) point here is clear: there is not very consistent evidence that heritability values in BG studies for all behavioral traits do, in fact, increase with age. On the contrary, the evidence for all behavioral traits taken together (rather than just intelligence, the only one BG defenders typically mention) is decidedly mixed and thus does not strongly contradict or support the "epigenetic approach" as Liu & Neiderhiser (2017) call it.
More criticisms of the argument that epigenetics has significant effects that are relevant to BG are made by Moffitt & Beckley (2015). First, they claim, "...methylation is ubiquitous and normative, and usually it has nothing to do with experience but is part of organism development that is, incidentally, under genetic control. Because the genome is identical in each of our cells, during normal development, most of our genes must be methylated, lest a kidney cell grow into an eye or a fingernail cell grow into an ear. Against this normative background, methylation marks that can be statistically associated with external experience are relatively rare, and effect sizes are expected to be small." They also have six more criticisms of epigenetics-centered human behavioral research, but criticisms 2-4 inclusive are all technical and centered around whether such research is feasible, not whether there is strong evidence for the reality of epigenetic effects on DNA expression and thus on behavior.
Before moving onto Moffitt & Beckley's last 2 objections, I will note something about the first sentence in the quote I cited in the above paragraph. They claim that methylation is part of the development of the organism, and that (this is crucial) this development is "under genetic control". Really? In any case, DNA methylation is only one kind of epigenetic process: there are also other processes like histone acetylation, "histone methylation, phosphorylation, or ubiquitination, to name a few" (Moore 2017). Thus, it is weird that Moffitt & Beckley devote 100% of their epigenetic-related attention in their article to DNA methylation. Moreover, they are claiming that environmental factors do not significantly affect DNA methylation and that this process does not significantly vary from a baseline level, but they do not cite any sources to support this claim.
What is objection 5? Here's an excerpt: "...although a small set of nonhuman studies provide initial evidence that experience can apparently alter methylation, it is far from clear that the detected methylation alterations have any consequences for health or behavior. Before methylation can affect health or behavior, it must alter expression of genes. Links from methylation data forward to gene expression data are not yet known." This is also an argument from Battaglia (2012). Charney (2012b) responded to Battaglia's argument that there is not very much evidence that epigenetics affects human behavior by saying,
According to Battaglia, though epigenetic effects are potentially important, the individual and specific impact on brain and behavior is neither well understood nor unambiguously linked to gene expression data. In support of this assertion, he mentions a study by Zhou et al. (2011). Whatever Battaglia's precise intent in mentioning this study, their conclusion unambiguously links epigenetic changes to changes in gene expression and behavior:
In addition to histone modifications, gene expression is also regulated by many components of the complex transcriptional machinery and also involves other mechanisms such as DNA methylation. Nonetheless, our results reveal genome-wide alteration of histone H3K4 trimethylation resulting from long-term cocaine and alcohol exposure, and accompanying large-scale changes in gene expression that implicate several functional pathways in substance-shared and substance-specific fashion. (Zhou et al. 2011, p. 6631)
There are also some baseless arguments-by-assertion merely claiming, with no supporting evidence, that epigenetic processes and their ability to mediate environmental effects on gene expression do not pose a fatal problem for BG studies. Here's an example from a response of some BG researchers to critiques (McGue et al. 2005): "Although the study of epigenetic phenomena may provide a powerful paradigm for developmental psychology, it will not obviate the need for twin, adoption, and family research like that reflected in our article (McGue et al., 2005)." This strange and totally unsupported argument has made its way elsewhere: Liu & Neiderhiser (2017, p. 100) cite McGue et al. (2005) and make the same exact claim with no additional support.
Other fallacies that rear their heads in the responses-to-epigenetics literature include the good-old-fashioned straw man. For example, you could construct a straw man version of epigenetics and developmental systems theory, and the associated schools of thought, according to which proponents of these ideas believe that DNA is totally irrelevant to human behavior. Of course, like any good straw man, this is a totally inaccurate representation of these people's views, but that doesn't stop Liu & Neiderhiser (2017, p. 100) from informing us that "DNA sequence variations are important and will continue to be important." Duh! Who are these imaginary epigenetics proponents claiming that DNA should be ignored entirely? They don't exist! If you wanna know what these individuals actually believe, maybe read some of their work, such as a recent paper by Overton & Lerner (2017, p. 117):
- "the burgeoning and convincing literature of epigenetics means that genetic function is a relatively plastic outcome of mutually influential relations among genes and the multiple levels of the context within which they are embedded (cellular and extracellular physiological processes, psychological functioning, and the physical, social, and cultural features of the changing ecology [e.g., Cole, 2014; Slavich & Cole, 2013])."
But BG researchers always have one more consistent "out" when confronted with epigenetics: claim that it can be incorporated into BG research. This is one of the most common answers to the question that forms the title of this post. Liu & Neiderhiser (2017), for instance, after casting doubt on the importance and DNA-independence of human epigenetics for almost two full paragraphs, tell us (p. 101), "In sum, we wish to emphasize that family-based behavioral genetic approaches are a promising way to study complex epigenetic effects and gene expression." This message seems oddly inconsistent with what they said in the previous dozen sentences or so, but OK. Moffitt & Beckley make a similar but distinct suggestion: that twin studies be used not to estimate heritability (their most common purpose historically), but to rule out potential confounding factors and biases:
"Dizygotic twins are ideal for testing what factors explain behavioral differences between siblings who are matched for age, sex, ethnic background, and most early rearing experiences. Discordant monozygotic twins are ideal for studying environmentally induced variation in the behavior of siblings matched even further, for genotype (Moffitt, 2005a)...The current recommendation from the experts is, if you plan to study human epigenetics, then at least use twins." (Moffitt & Beckley 2015)I admit, that last sentence made me chuckle (it's clearly a reference to the common cliche about at least using a condom if you plan to have sex). Note that in making this recommendation, Moffitt & Beckley do not argue that classical twin studies or heritability estimation are scientifically valid or worthwhile; instead they try to argue that twin studies should be used for a totally different purpose.
Subscribe to:
Posts (Atom)