In my own state, Georgia, Kemp won the governor's race with 50.2% of all votes cast, to Abrams' 48.8%. Using CNN's exit poll to estimate the results yields the following estimates for the gender exit poll:
Kemp = (.52*.46)+(.49*.54) = 50.4%, so 0.2% high.
Abrams = (.46*.46)+(.51*.54) = 48.7%, so 0.1% low.
For age (4):
Kemp = 49.9%, so 0.3% low.
Abrams = 48.8%, so exactly right.
For age (6):
Kemp = 49.7%, so 0.5% low.
Abrams = 48.0%, so 0.8% low.
Using the Excel spreadsheet I just threw together it is easy to calculate estimates for any race if you have the exit poll results (% of voters in each group and voting results by group). If you do it for the FL governor's race (won 49.6%-49.2% by the Republican Ron DeSantis; CNN's exit poll is here), you get this:
Gender: DeSantis = 49.8% (0.2% high), Gillum 48.7% (0.5% low).
Age (4): DeSantis = 49.9% (0.3% high), Gillum 48.8% (0.4% low).
Age (6): DeSantis = 49.0% (0.2% low), Gillum 48.3% (0.9% low).
For this Age (6) poll, the probable reason the estimates for both are a bit low is that 4% of 30-39 year old voters responded "No Answer" when asked who they voted for. Was this because they voted for a third-party/independent candidate, or did they not vote (for governor at least) at all? Probably a combination of both, but some of them probably just didn't answer even though they actually voted for DeSantis or Gillum.
CA: Democrat Newsom won the governor's race in CA with 61.9% of the vote to 38.1% for Republican Cox. Notably, it seems like these were the only two candidates on the ballot because of CA's weird runoff system, so 100% of all votes were for one or the other. Because some exit poll results have at least 1% of respondents refusing to answer we have to make all percentages based on the % of respondents who did answer (100%-the % who didn't answer).
Using CNN's exit poll for that state yields these estimates for the results (all errors are +/- based on value of (estimated-actual)):
Gender: Newsom 60.9% (-1%), Cox 39.1% (+1%)
Age (4): Newsom 60.8% (-1.1%), Cox 39.2% (+1.1%)
Age (6): Newsom 60.7% (-1.2%), Cox 39.3% (+1.2%)
Monday, March 18, 2019
If only X could vote
Based on CNN's exit polls from the 2016 election by state, in the states where these polls were conducted, here are what the results of elections would have been if only members of group X could vote. Light color (red/blue) = less than 5% win, medium = 5-10% inclusive, and dark = 11% or more (if a state margin is between 10 and 11%, it will be medium color; this only applies to Oregon in the first map).
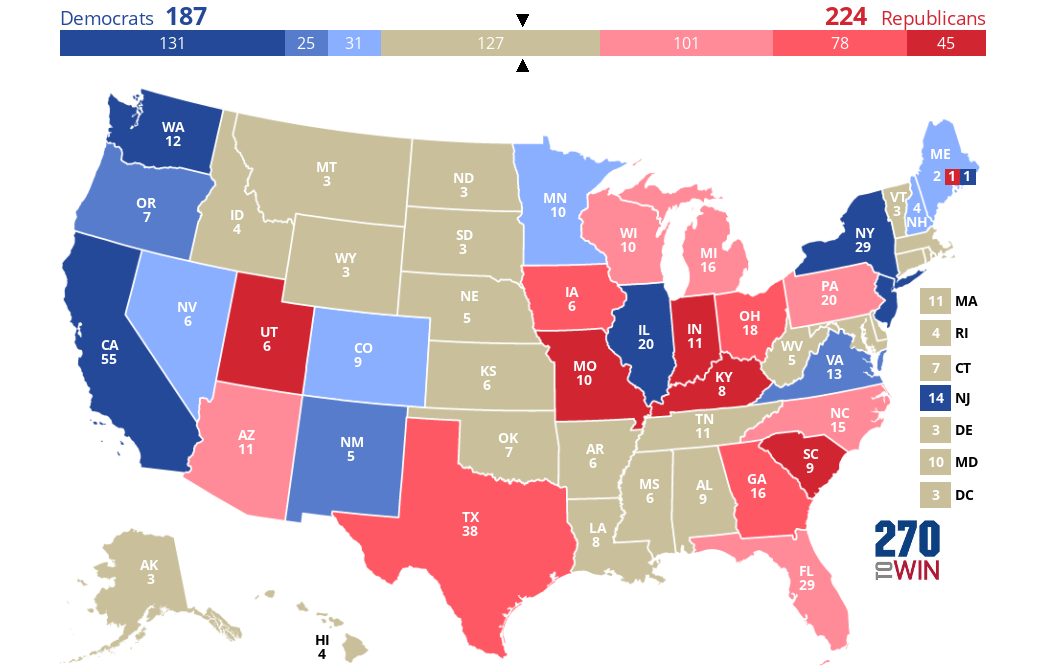
Let's start by taking the actual 2016 EV results (recall they were 306 Trump, 232 Clinton) and grey out all the states that CNN does not have exit polls at all for. As you can see plenty of states are grayed out--mostly ones Trump won in the Great Plains/Western area, as well as some Trump-loving southern states and a few liberal ones in the Northeast. The 2016 exit poll included 28 states, excluding 22 states and DC. In total, we see Trump with 224 EVs and Clinton with 187, so no one has enough to win here:
Note that in the hypothetical scenarios below I will be giving all of Maine's 4 EVs to the same candidate (even though this might not actually happen, and didn't actually happen in 2016).
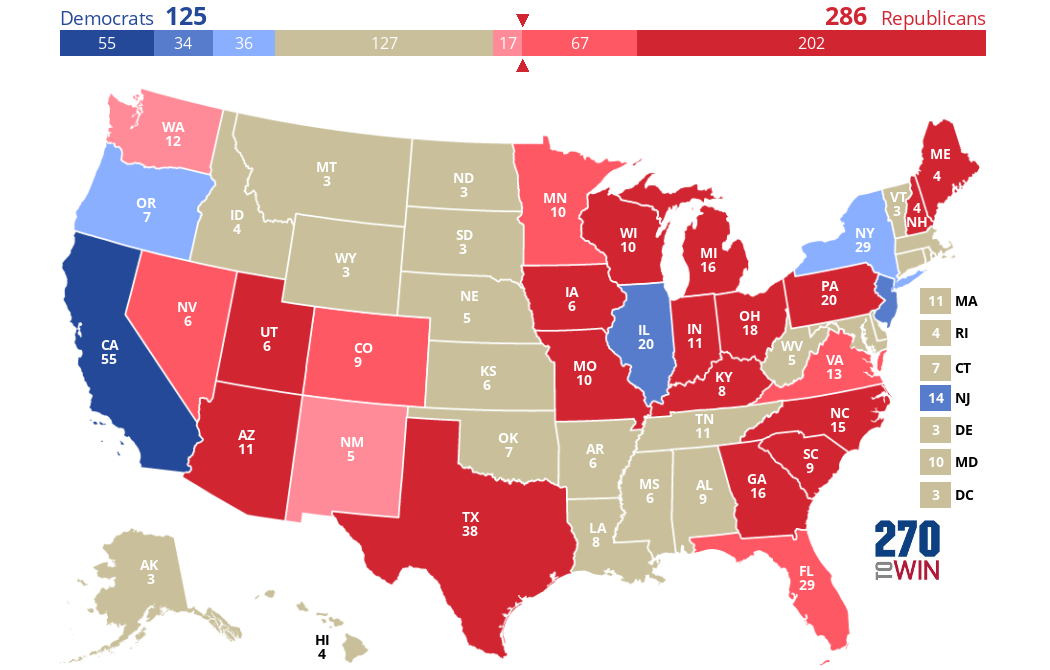
If only men could vote, Clinton would lose 62 EVs in these states, and would win only 125 EVs. Trump, meanwhile, would gain all 62 of these EVs and be able to win the Electoral College even without the excluded states (most of which he actually won anyway). These Trump gains/Clinton losses come from Minnesota, Nevada, Washington state, Colorado, New Mexico, Maine, New Hampshire, and Virginia--Clinton won all of these states but more men voted for Trump than for her in each of them:
Let's start by taking the actual 2016 EV results (recall they were 306 Trump, 232 Clinton) and grey out all the states that CNN does not have exit polls at all for. As you can see plenty of states are grayed out--mostly ones Trump won in the Great Plains/Western area, as well as some Trump-loving southern states and a few liberal ones in the Northeast. The 2016 exit poll included 28 states, excluding 22 states and DC. In total, we see Trump with 224 EVs and Clinton with 187, so no one has enough to win here:
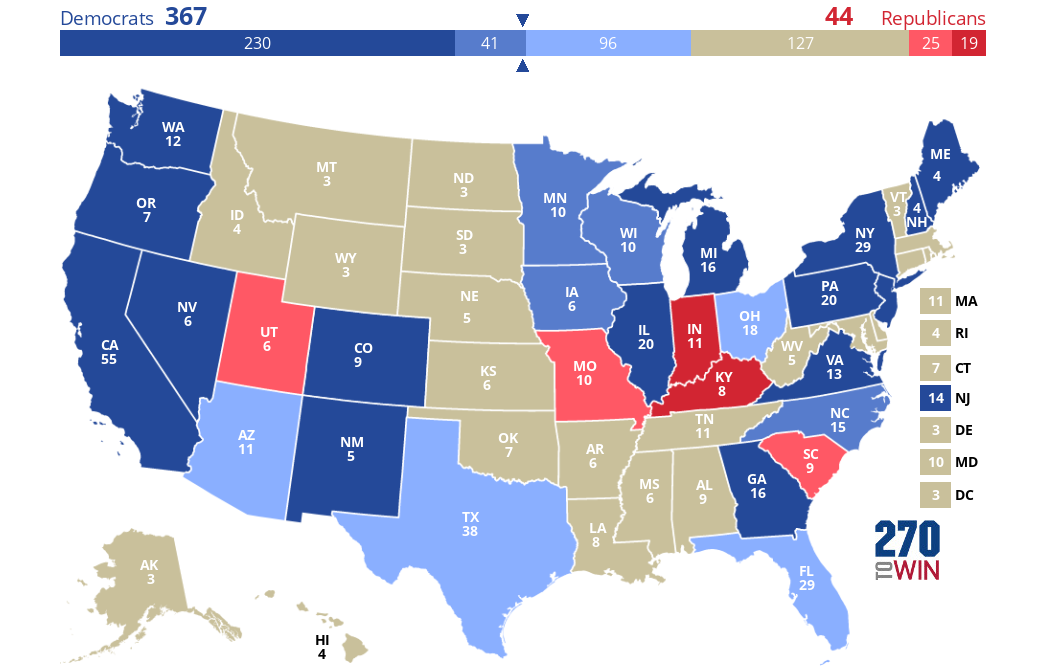
But if only women could vote, unsurprisingly, Clinton would do extremely well, flipping many states Trump won and getting a whopping 367 EVs:
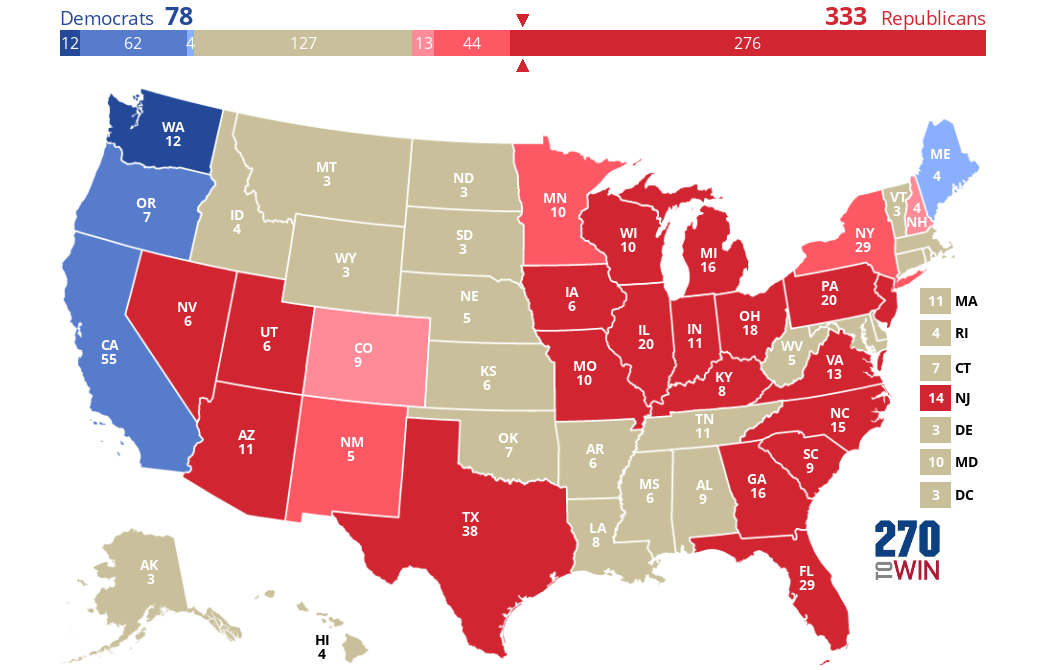
If only white people could vote, the results would be even more favorable to Trump than they were with men. Clinton would hang on to ME and WA, but lose NY, NJ, and even her birth state of IL! The result would be Trump getting a whopping 333 EVs, way more than enough to win:
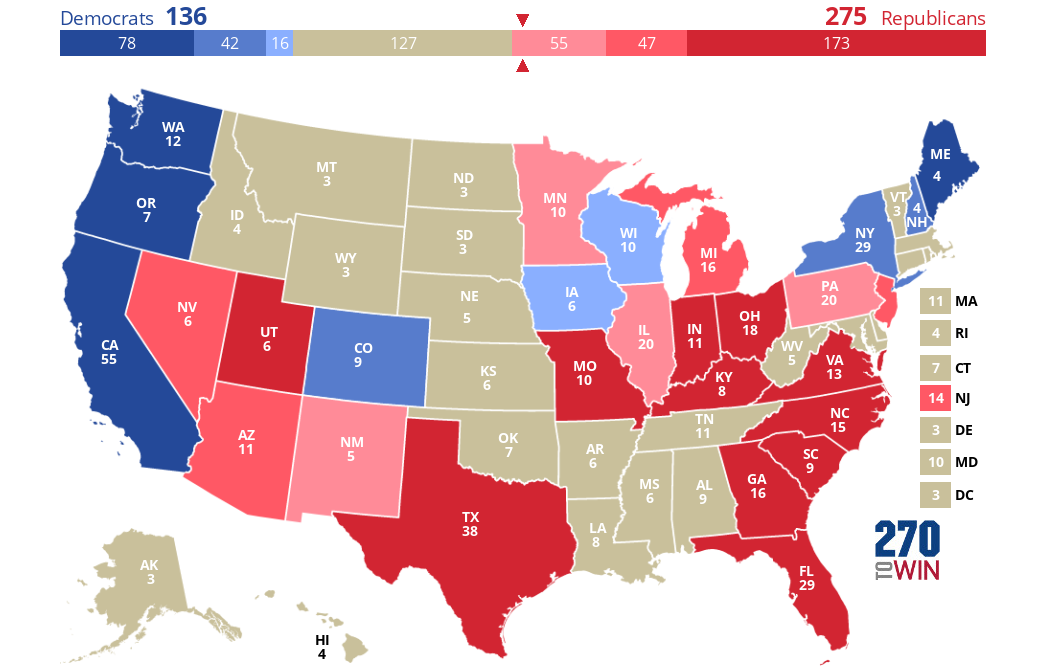
What about if only white women could vote? We've heard a lot about white women since 2016 because most of them voted for Trump that year (despite most women in general voting for Clinton, as usual for Democratic candidates). The results reveal some strange patterns: some states flip in Clinton's favor (IA and WI) compared to the actual results, while other states (e.g. NJ, MN, and IL) actually flip the other way. In all, Trump gets 275 EVs, just enough to win, and Clinton only gets 136. This represents a Republican gain of 51 EVs compared to the actual results (again only based on the states w/exit polls):
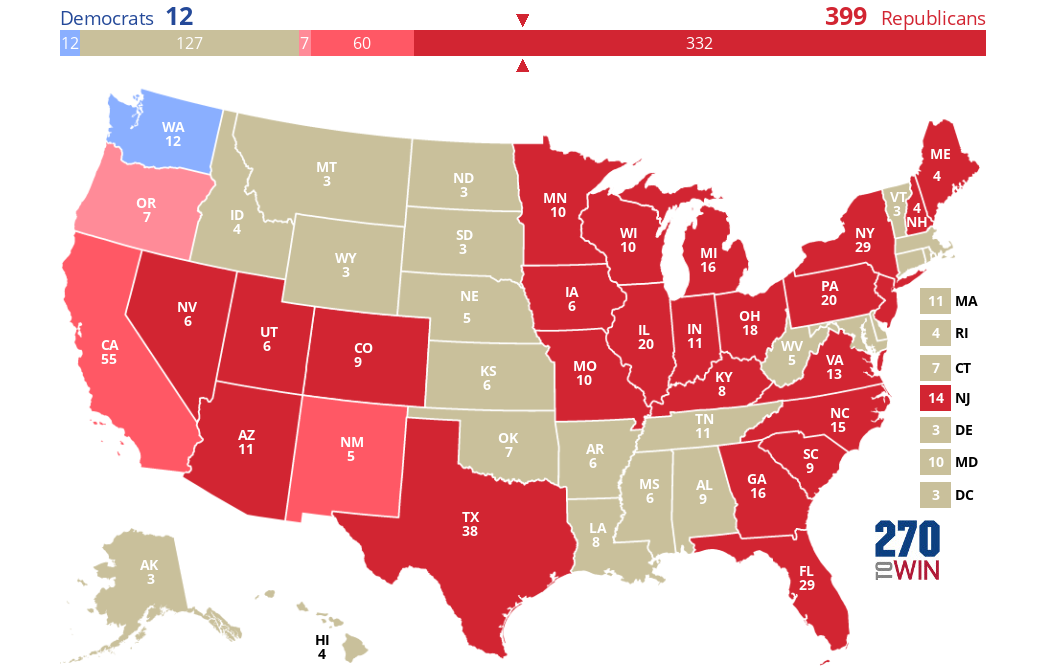
Also, it seems obvious that if only white men could vote, Trump would absolutely crush Clinton almost everywhere, no? Indeed he would have, and the result is so lopsided even I was surprised by it:
Yes, you're reading that right: the only state (included in CNN's exit polls) where more white men voted for Clinton than Trump is Washington state! So of course Trump would win easily in this scenario, with a whopping 399 EVs compared to only 12 for Clinton.
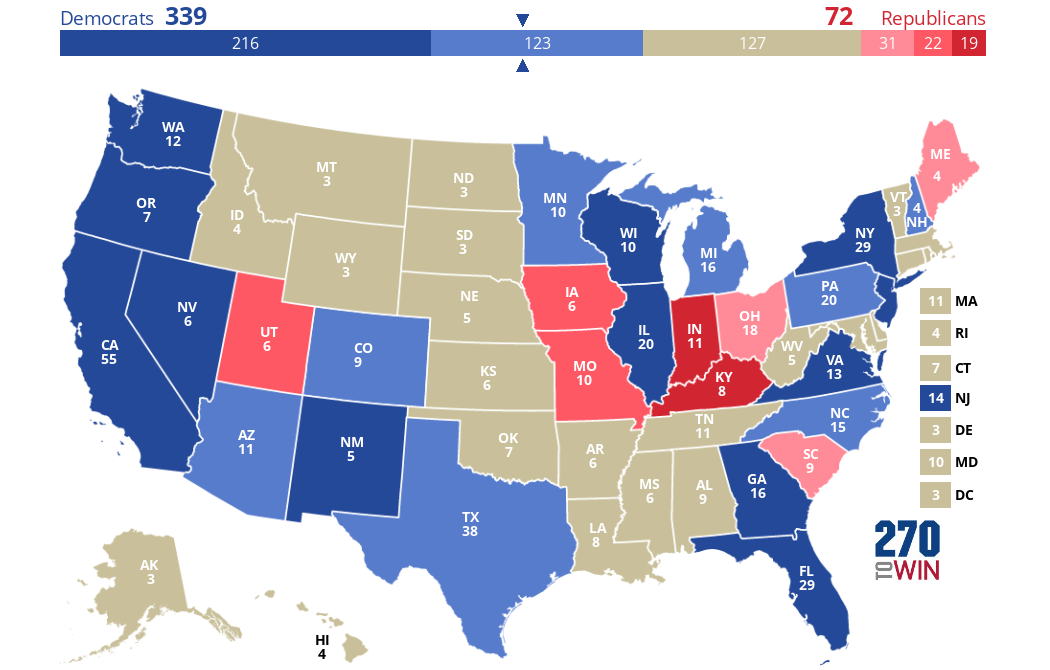
If only people aged 18-45 could vote, Clinton, no surprise, would do very well, winning all but 8 states included here. This would result in her getting 339 EVs, 152 more than she actually got in the included states. Oddly, one state would actually flip from Clinton to Trump if only those under the age of 45 could vote: Maine.
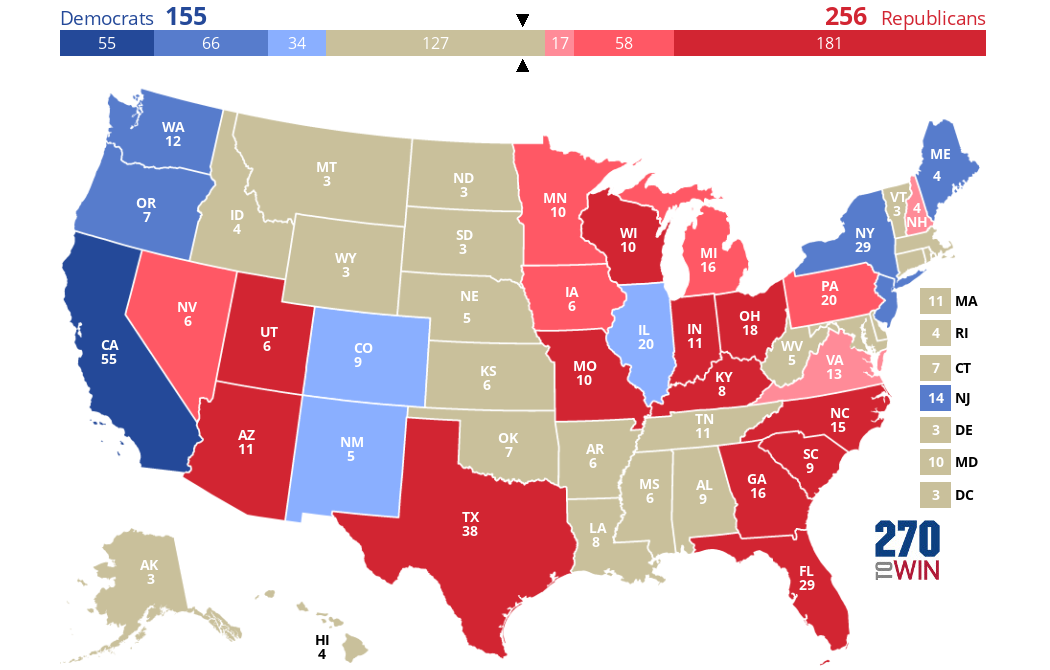
But if only people 45 or older could vote, we would see Clinton lose a bit of ground relative to her real performance.
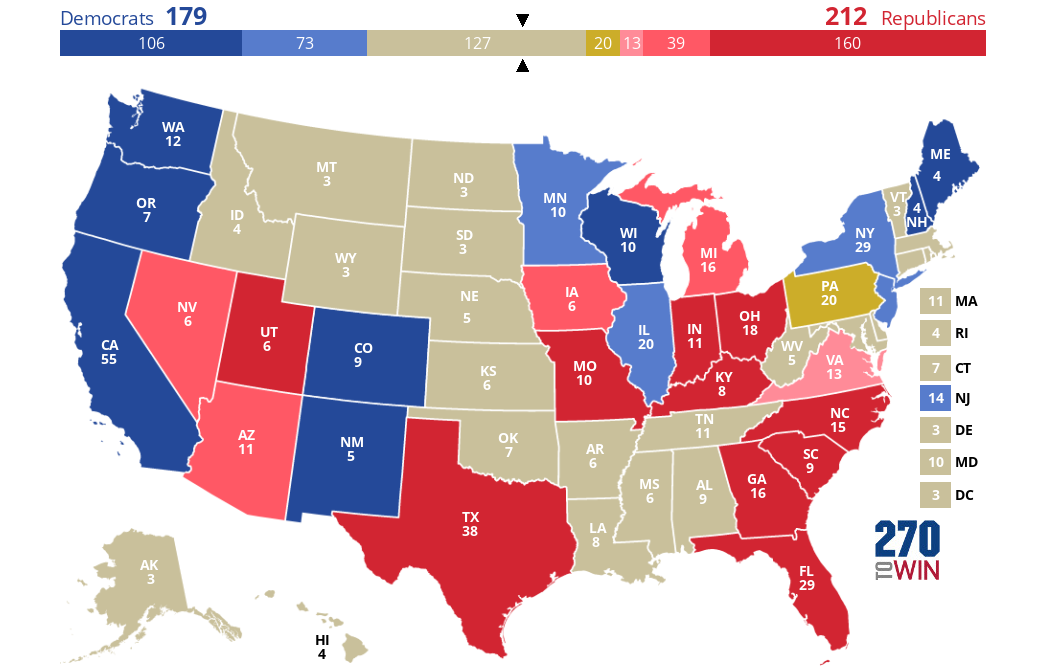
Finally, if only white people with college degrees could vote, Trump would get 212 EVs (12 less) to Clinton's 179 (8 less). Note that Pennsylvania is marked "other"; this is because the white college graduate vote was split exactly evenly (48-48) in that state.
In conclusion, ranking demographic groups from most to least Republican gives this result:
- White men
- White people overall
- Men overall
- White women
- People 45/older
- The American electorate overall
- White college graduates
- People under the age of 45
- Women overall
Monday, March 11, 2019
Why do hereditarians love the word "empirical" so much?
In this post I cite examples of hereditarian IQ/race/genetics researchers (Robert Plomin, Ian Deary, etc.) using appeals to "empirical" evidence to support their views. Their use of the word "empirical" specifically to defend themselves against their critics recurs weirdly often to the point where they seem to "get off" on using this word. And often their uses of it seem entirely redundant in the context in question. All emphases that follow are mine.
Example 1: "Concerning the equal environments assumption in general, empirical data based on most twin studies ever published point to little or no influence of shared environmental factors on twin similarity" (Arden et al. 2016).
Example 2: "A theoretical logic provides a useful framework for considering the empirically discovered links between intelligence and health. This framework is useful in generating empirical research questions such as ours" (Arden et al. 2016).
Example 3: [After describing E.G. Boring's 1923 quote "Intelligence is what the tests test"] "The apparently dismissive comment
came after a summary of strong empirical findings — for example, that the tests
showed marked individual differences, that the differences were stable over time, that
children developed greater intelligence over time but tended to maintain the same
rank order" (Deary et al. 2010, p. 202).
Example 4: "[Psychologist Howard] Gardner has intentionally avoided empirical tests of his theory [of multiple intelligences or MI], but those that have been made show most
of his MI to be correlated with one another...The theories that do not accommodate this finding [referring to the positive correlations between different mental tests] — such as those of Thurstone, Guilford, Sternberg
and Gardner — fail the most basic empirical tests" (Deary et al. 2010, p. 204).
Example 5: "More than 100 years of empirical research provide conclusive evidence that a general factor of intelligence (also known as g, general cognitive ability, mental ability and IQ (intelligence quotient)) exists, despite some claims to the contrary" (Deary et al. 2010, "Key points").
Example 6: "...we estimated the heritability of height from empirical genome-wide identity-by-descent sharing..." (Visscher et al. 2006)
Example 7: "...the empirical variance of IBD sharing is likely to be an underestimate because the marker information was not perfect" (Visscher et al. 2006).
Example 8: "They also failed to highlight that the theoretical discussion actually revolved around
an empirically testable question...To conduct the test, I drew on an empirical model..." (Littvay 2012)
Example 9: "The findings place the burden on critics to present theoretical work on the specific mechanisms of EEA violations based on which additional empirical assessments could (and should) be conducted." (Littvay 2012)
Example 10: "...these criticisms, like most of the literature questioning the validity of the EEA [equal environments assumption], are made on the basis of secondary analysis of published research, not on the basis of empirical examination of CTD [classical twin design] assumptions on political variables." (Smith et al. 2012, p. 19)
Sunday, March 3, 2019
On the representativeness of exit polls I: the 2016 general presidential election
If exit polls are perfectly representative of the electorate, then calculating the percent of votes each candidate received in a given state from the exit polls conducted there should exactly match the actual percent of the vote each candidate actually received in that state. So I'll try to do exactly that here from the 2016 exit polls conducted by CNN.
I will start with my own state, Georgia. So what actually happened in this state was that Trump got 50.4% of the vote, while Clinton got 45.3%. So if we look at the gender exit polls for Georgia, we see the following:
I will start with my own state, Georgia. So what actually happened in this state was that Trump got 50.4% of the vote, while Clinton got 45.3%. So if we look at the gender exit polls for Georgia, we see the following:
- 55% of voters were female, 45% were male.
- Of the female voters, 54% voted for Clinton, while 43% chose Trump.
- Conversely, of the male voters, 60% chose Trump while only 37% chose Clinton.
So, assuming we are focusing only on Georgia, let M be the event that a election voter is a male, C be the event that they voted for Clinton, and T be the event that they voted for Trump. The exit polls thus indicate that:
- P(M) = 0.45,
- P(C|M) = 0.37,
- P(T|M) = 0.6,
- P(F) = 0.55,
- P(C|F) = 0.54, and
- P(T|F) = 0.43.
So we can estimate Trump's total vote share from these data by multiplying the % of voters who were of each sex by the % of each sex who voted for him. Doing this gives (45%*60%)+(55%*43%)=27.0%+23.7%=50.7%. This matches up quite nicely with the actual percent of the vote he got in Georgia (it's only 0.3% higher than his actual result of 50.4%), so the poll appears to be quite representative.
But what about Clinton? Let's do the same thing for her:
(45%*37%)+(55%*54%)=16.7%+29.7%=46.4%. This is 1.1% higher than the 45.3% of the vote Clinton actually got, so it's a little further off than with Trump.
What about race? 60% of those in the exit poll were white, and 30% were black. But let's break everyone into a dichotomous category of white vs. non-white, as CNN does for some of their exit polls. So we have 60% white voters and 40% non-white voters. Needless to say, Trump did much better among white voters than among non-white voters: he got 75% of the white vote but only 14% of the non-white vote.
This indicates that Trump would receive (60%*75%)+(40%*14%)=45%+5.6%=50.6%. Again, we are very close (only 0.2% away) to Trump's actual result of 50.4%. For Clinton, she got only 21% of the white vote but 83% of the non-white vote. This points to (60%*21%)+(40%*83%)=45.8% of the vote. This is also close to (0.5% more than) the 45.3% of the vote she actually got.
Lastly, age. Let's again split people into two categories: 18-44 and 45 and older. Of 18-44 year olds, Clinton beat Trump 55 to 40. But among those 45 and older, Trump beat Clinton 60 to 38. 46% of voters were 18-44 and the remaining 54% were 45 and older.
So this indicates that Clinton got 45.8% of the vote, again 0.5% more than the actual amount. Trump would be predicted to get 50.8% of the vote, or 0.4% more than he actually got.
If you use the data broken down by six different age groups instead, you get a Clinton prediction of 46% and a Trump prediction of 50.68%.
All of my results for Georgia are shown in the table below. The parentheses in the left column are the number of categories each set of results is broken down into (e.g. Race (2) = just "white" and "non-white").
| Georgia | C | T | How far off (Clinton)? | How far off (Trump)? |
| Actual | 45.3% | 50.4% | ||
| Sex | 46.4% | 50.7% | 1.1% | 0.3% |
| Race (2) | 45.8% | 50.6% | 0.5% | 0.2% |
| Age (2) | 45.8% | 50.8% | 0.5% | 0.4% |
| Age (6) | 46.0% | 50.7% | 0.7% | 0.3% |
| Age (4) | 46.2% | 50.6% | 0.9% | 0.2% |
| Race (5)* | 42.0% | 48.8% | -3.3% | -1.6% |
| Race & gender | 43.8% | 50.3% | -1.5% | -0.2% |
*I should note here that this was broken down into 5 categories, but there are 2 ("Asian" and "Other race") with no results given for how they voted. This explains why the estimates based on these specific polls are both much lower than the actual results.
Next I chose Arizona solely because it's the first state listed on CNN's exit poll page (they're listed alphabetically and they didn't do AL or AK for some reason). Note that with many of these poll results you also have significant percentages of the voters for which there are no estimates of how they voted (these will all be denoted with an asterisk). Specifically, for AZ, there were no voting data for 14% of the voters in the Age (6) poll, for 9% of those in the Race (5) poll, and for 9% of those in the Race & gender poll. This leads to estimates of the results (% of all votes for each candidate) that are always somewhat lower than the actual values. That being said, my results are here:
| Arizona | C | T | How far off (Clinton)? | How far off (Trump)? |
| Actual | 44.6% | 48.1% | ||
| Sex | 44.6% | 48.9% | 0.0% | 0.8% |
| Race (2) | 44.8% | 48.5% | 0.2% | 0.4% |
| Age (2) | 44.7% | 48.9% | 0.1% | 0.8% |
| Age (6)* | 37.6% | 44.3% | -7.0% | -3.8% |
| Age (4) | 44.4% | 48.5% | -0.2% | 0.4% |
| Race (5)* | 39.2% | 45.2% | -5.4% | -3.0% |
| Race & gender* | 39.7% | 44.6% | -4.9% | -3.5% |
| Education (4) | 44.7% | 48.8% | 0.1% | 0.7% |
| Education (2) | 44.5% | 48.5% | -0.1% | 0.4% |
From this we see clearly that these polls seem to be quite representative of the entire electorate in these two states. In almost all cases without a lot of missing data, we see errors of less than 1 percent! In all cases without entire groups where we have no clue how they voted, we see errors of less than 2%.
Let's look at the entire country now. Overall, Trump received about 45.9% of the popular vote in the US as a whole, and Clinton received 48.0%. Conveniently, we can include not just CNN's national exit poll results, but also the New York Times'.
Lastly, I included California exit poll results (also from CNN) because it is the most-populated state, so surely they should be especially accurate there.
My results for the entire country, as well as for AZ, CA, and GA, are shown below. Note that these results include only the MOV as estimated from each exit poll category (sex, race (2), etc.), not the % estimated for either candidate. Overall we see that the exit polls seem to be very representative. We see that excluding missing data (corresponding to all values shown in red below) makes both the AZ and CA exit polls more accurate, but it has no effect for the national polls for the simple reason that missing data was nonexistent for these polls, and for GA this exclusion actually made the estimated MOV less accurate.
Lastly, CNN's national exit poll matched the actual results much more closely than did the Times'. Why? CNN's national poll was based on 24,558 respondents, while the Times' was apparently based on 24,537. It seems unlikely that those 21 extra voters made such a big difference in accuracy between the two polls. Additionally, at the bottom of the page for the Times' poll, it says: "Data for 2016 were collected by Edison Research for the National Election Pool, a consortium of ABC News, The Associated Press, CBSNews, CNN, Fox News and NBC News." This seems to imply that the source for CNN's and the Times' exit poll data is actually exactly the same. Why the results are slightly different, then, is not clear (e.g. CNN says Trump got 52% of the male vote, Times says 53%).
| MOV | AZ | CA | GA | National (NYT) | National (CNN) |
| Sex | -4.3% | 28.7% | -4.3% | 0.5% | 1.7% |
| Race (2) | -3.8% | 29.4% | -4.8% | 0.0% | 1.2% |
| Age (2) | -4.3% | 29.7% | -5.0% | 0.0% | 1.7% |
| Age (6) | -6.7% | 29.6% | -4.7% | 0.0% | 1.6% |
| Age (4) | -4.1% | 29.5% | -4.5% | 0.6% | 1.8% |
| Race (5) | -6.0% | 28.1% | -6.8% | 0.9% | 1.8% |
| Race & gender | -4.9% | 24.7% | -6.4% | 0.0% | 1.9% |
| Education (4) | -4.1% | 28.2% | -4.5% | 1.1% | 1.9% |
| Education (2) | -3.9% | 28.6% | -5.0% | 0.0% | 1.5% |
| Average | -4.7% | 28.5% | -5.1% | 0.3% | 1.7% |
| Average (excl. miss.) | -4.1% | 29.1% | -4.7% | 0.3% | 1.7% |
| Actual MOV | -3.5% | 30.0% | -5.1% | 2.1% | 2.1% |
Subscribe to:
Posts (Atom)